


Talking Points
- Moving Average crossovers are a popular way traders use this indicator
- A valid crossover happens when the faster moving average crosses either above a slower moving average which would be called a bullish crossover or below which is called a bearish crossover
- When the 50-day simple moving average crosses below the 200-day simple moving average, it is commonly called a “Death Cross” and signifies a large bearish move.
What is the ‘Death Cross’ pattern?
Though its sounds scary and ominous, the ‘Death Cross’ (DC) pattern is neither. In fact, consumers that are tired of paying $80 or more to fill up their gas tank will rejoice at what this pattern means to the price of oil. The DC occurs when the short-term 50-day simple moving average crosses below the 200-day simple moving average. Typically, in a moving average crossover, a shorter term moving average crosses below a longer term moving average a sell signal is generated and price is expected to move lower. What makes the DC different is that the 200-day SMA is watched by so many traders to determine long term bullishness or bearishness that when the 50-day crosses below the 200, the selling can be substantial as institutional and retail selling converge.
Learn Forex: USOil Moving Average Death Cross
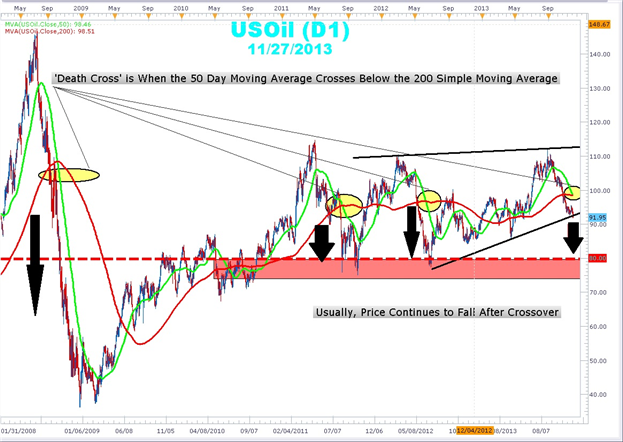
(Created using FXCM’s Marketscope 2.0 charts)
In the chart above there are 4 DCs on USOil which led to significant price moves lower. There is one DC on June 18, 2010 in which the decline was minimal. In fact, since 1984, there has been 21 Death Cross (DC) formations on oil with an average decline of 8.3% over the following 6 months after the crossover. With the current price of oil just south of $92.00 per barrel, we could see a decline down to the $80- $84.00 region once oil closes, on a daily basis, below the current trend line. This will be good news for oil bears and US holiday drivers but bad news for Oil bulls, for now.
In each of case of the DC, the following price decline was short-lived and a sharp rebound followed. This could give new life and a great entry point for those who are bullish oil. Such a rebound would need confirmation. Oil bulls will wait their turn and may look for the advent of the Golden Cross before initiating longs. The Golden Cross is made up of the 50-day simple moving average crossing above the 200-day simple moving average and is a major buy signal. The DC is nothing to fear if you know which direction to trade. It marks the possible acceleration and extension of and oil “slide” lower.
---Written by Gregory McLeod Trading Instructor
This article showed you how look for a triangles to find a potential trade setup. I want to invite you to enroll in our free Trade Like a Professional Certificate Course. Sign our Guestbook to gain access to this course that will help you get up to speed on Forex market basics. You can master the material all while earning your completion certificate. Register HERE to start your Forex learning now!


