


Article Summary: The EURGBP has recently tested resistance after a 250 pip advance. As the pair stalls traders can turn to DMI to find the prevailing trend.
The primary objective of a Forex trader is to find market direction. There are a variety of methods for finding the trend however interpreting price action can often be difficult and sometimes misleading. To help ease in this process traders often will employ the use of technical indicators.
In todays example we will be looking at the EURGBP daily chart pictured below. The pair has advanced as much as 394 pips from its July 23 low. However, resistance has been met near its October high at .8164. So what is a trader to do in present markets? Which direction is the EURGBP trending? To answer these questions, we will tae a closer look at the DMI indicator.
Learn Forex – EURGBP Daily Trend
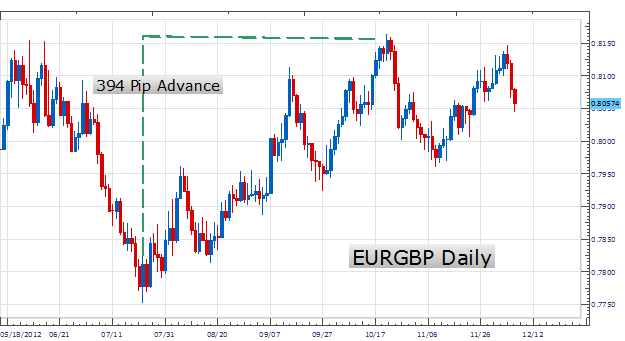
(Created by Walker England)
The DMI indicator is derived from two lines, the positive directional movement indicator (DMI+) and the negative directional movement indicator (DMI-). Both lines run in a range between 0-100 to help identify if a currency pair is trending up or down. The DMI + line is depicted as a green line and as its name suggests helps track price in an uptrend. The DMI - line is depicted as a red line and measures the strength of a downtrend. Traders will watch both lines as they oscillate between 0-100 and change their market preference as one line crosses above the other.
Reading DMI is relatively straightforward. Traders will look for the DMI line that is moving higher than the other. This is also known as the dominant DMI line. In the chart below, DMI + has crossed above DMI - , making it the dominant DMI line and suggesting that the trend is up. If DMI – was the dominant line the opposite would be true. Traders would then conclude that the market was intending to move lower.
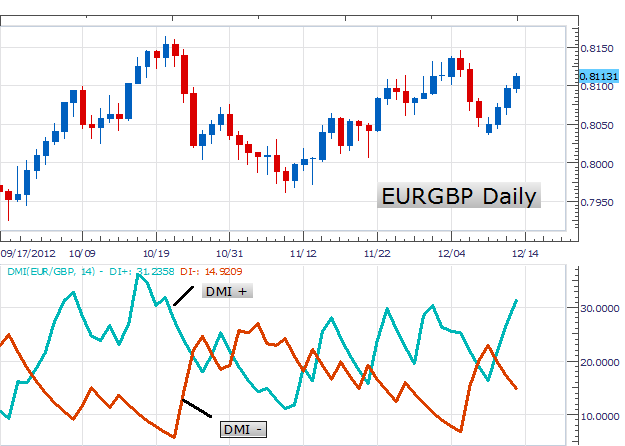
(Created by Walker England)
Using DMI my preference is to look for continued strength on the EURGBP. This will continue as long as DMI + remains above DMI -. One way to trade this market bias is to look for breakouts toward higher highs. If DMI + increases in value, traders may look to employ a trending strategy as
An alternate scenario includes price moving to higher highs. If this occurs traders will be notified as the DMI - line will cross back above DMI +.
Next: What is the Number One Mistake Forex Traders Make? (24 of 50)
Previous: Trading the Rate of Change Indicator
---Written by Walker England, Trading Instructor
To be added to Walker’s e-mail distribution list, CLICK HERE and enter in your email information.


