


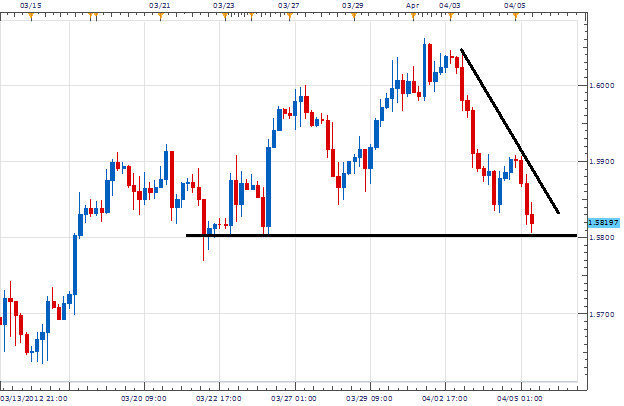
The GBPUSD has been moving higher, since we last discussed the triangle pattern depicted below in the April 5th edition of Chart of the Day. Price quickly ascended over 300 pips to currently create fresh 2012 highs despite negative data released on the economic calendar. Today Gross Domestic Product number was released out of the UK at -.2%. This negative growth is indicative of an economic slowdown but yet the GBPUSD pair has somehow managed to rally. Technical traders will look for areas of resistance on their charts to spot points of fresh breakouts or a return of price to lower lows.
Looking at the daily chart below, we can better see the GBPUSD setting 2012 highs with today’s price action near 1.6080. Price last tested this point in October of 2011 when price reached as high as 1.0656. Currently this level stands as resistance on the chart and provides an opportunity for a range trade if this level holds. Range traders will look for price to return to support at 1.5300 created by connecting price from October 2011 and January 2012 lows.
To assist us in gauging fresh downside momentum, we can employ the MACD oscillator. One way to use MACD is to find divergence which is a directional separation of price from the indicator. Hidden divergence is depicted below as price is creating higher highs, while MACD is forming lower highs. This can be an oscillator trader’s first clue at a potential price pullback. Once direction is decided, we can use a MACD line cross of the signal line to enter into our trade.

My preference is to sell the GBPUSD using a MACD crossover. Entries should be taken under resistance near 1.6170. Stops should be placed over resistance at 1.6370. Limits should look for a 800 pips of profit near support for a 1:4 Risk/Reward profile.
Alternative scenarios include price breaking upward out of our range reaching for higher highs.
---Written by Walker England, Trading Instructor
To contact Walker, email WEngland@FXCM.com . Follow me on Twitter at @WEnglandFX.
To be added to Walker’s e-mail distribution list, send an email with the subject line “Distribution List” to WEngland@FXCM.com .
DailyFX provides forex news on the economic reports and political events that influence the currency market. Learn currency trading with a free practice account and charts from FXCM.


