


The BIG Idea: When looking to the interest rate futures market, there is an expected cut by the Federal Reserve in the US reserve rate from June 2019-June 2020. When looking to the Federal Reserve’s expectations (aka educated guesses), they are looking to two cuts, which would likely be firmed on a Trade War ‘truce’ between the US & China. Ironically, the US Dollar is falling because the Fed is concerned the environment is turning too sour to warrant further hikes. However, an improvement in data would reignite the Fed’s outlook and firm up expectations for future Fed hikes that would likely strengthen the US Dollar.
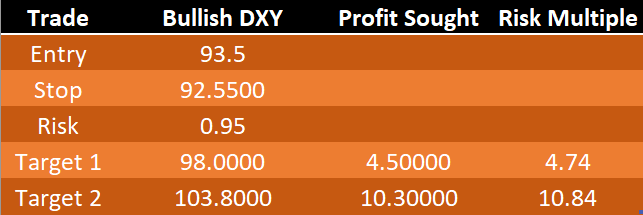
Point to Establish View: Initiation near 94-93 (H2 2018 support zone)
Spot: DXY @ 94.809
Objective 1: 98 (Fibonacci target,) > 1:1 Risk: Reward Ratio
Objective 2: 103.80 (2016 high)1:10.8 Risk: Reward Ratio
Objective 3: Hold with Trailing Stopon a close below 50-DMA or Ichimoku Cloud
Idea Invalidation Level: 92.55 (50% of 2018 range) 145-45 pip stop depending on entry
Access Our Q1 2019 Currency Forecasts for FREE here
View Structure
The BIG Picture:
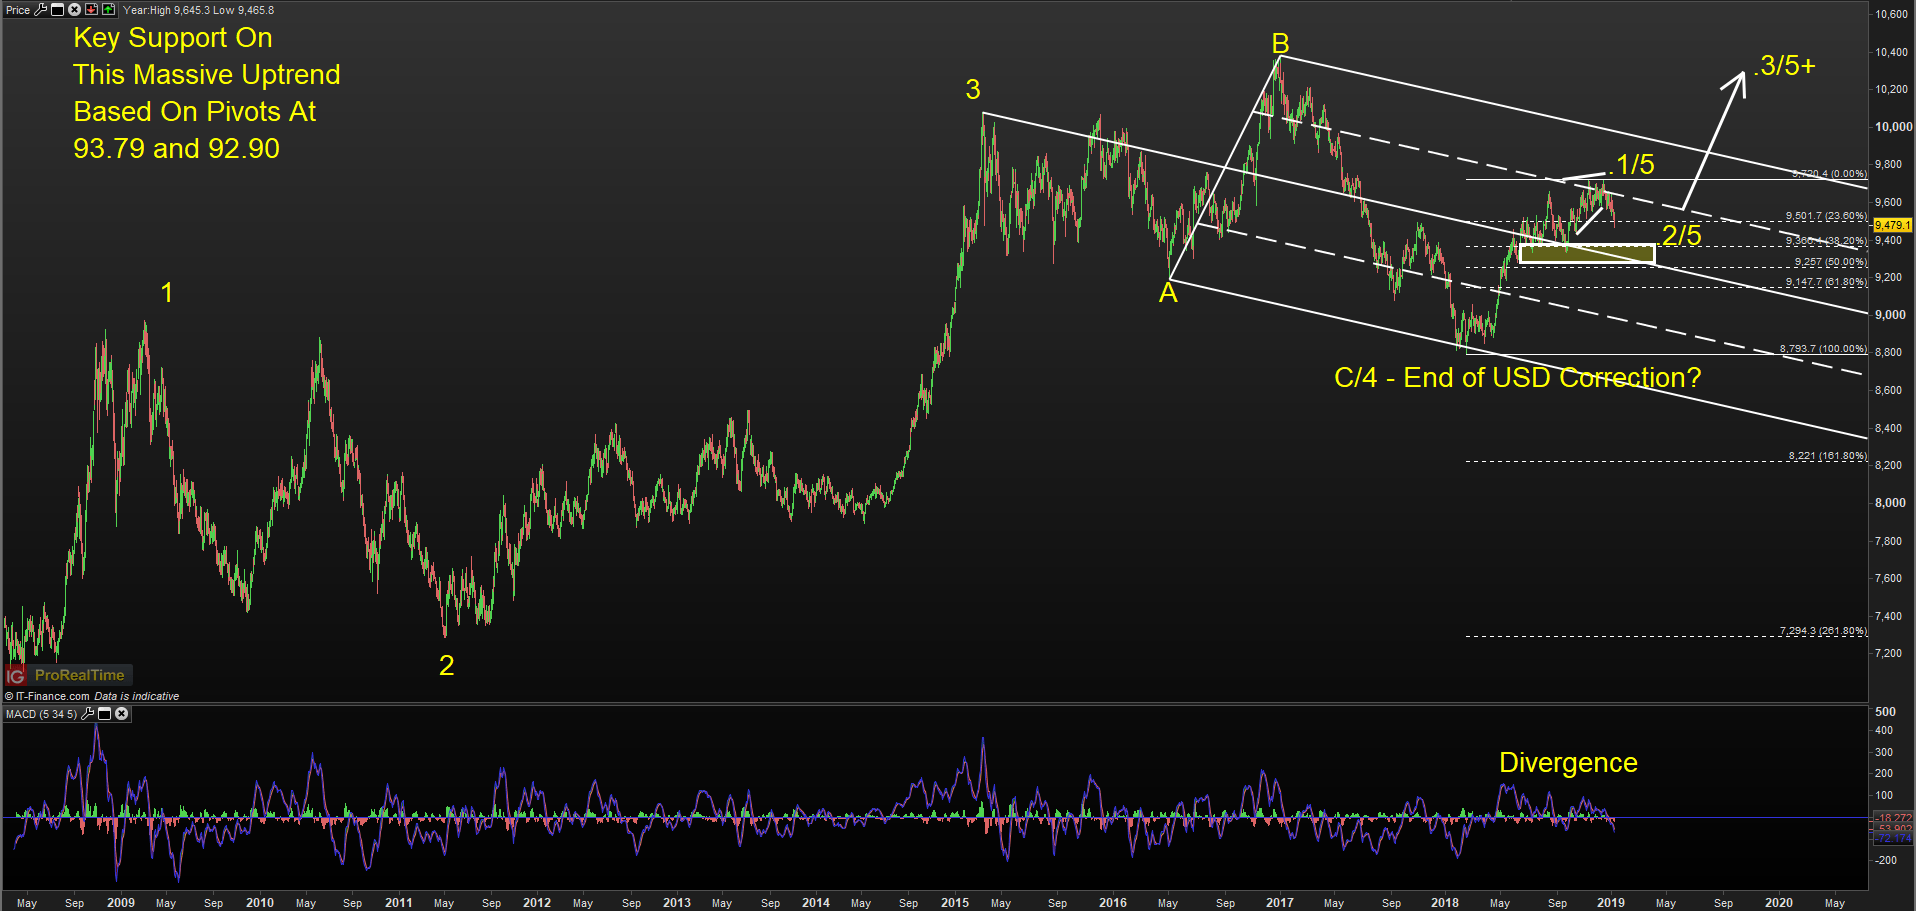
Chart Source: Pro Real Time with IG UK Price Feed. Created by Tyler Yell, CMT
Technical Reasoning Behind the Trade
The labels on the DXY chart above align with Elliott Wave analysis. The purpose of Elliott Wave is to put current market moves in a context that can help you create probability weighted outcomes that can help traders anticipate opportunities and manage risk for when the outlook changes.
The challenge with Elliott Wave is deciphering the correct corrective/ non-trending moves. These are seen as waves 2-4-B. These are important Because waves 1-3-5-A-C being the strongest and most aggressive moves in the direction of the trend.
Above, you’ll notice that the expanded wave fourlabeled A-B-C from 2015-2018 is seen as preceding a potential wave five that could take the US Dollar to new post-2008 highs. The set-up for this trade anticipates that we’re in corrective-wave 2 of wave five that could aggressively move higher if this move plays out as analyzed.
Lastly, the relationship between the corrective waves is very important. The 2009-2011 corrective wave 2 was 113 weeks or 2 years and two months. The 2015-2018 was near 1.382% (a Fibonacci relationship) the length of the 2009-2011 correction at 153 weeks.
Should we be embarking on the start of wave 3 of 5 in DXY, we could see a very strong rally that could have EUR/USD lower and USD/JPY much higher.
Fundamental Justification For Bullish DXY View
The technical justification can be summarized as saying, I think we’re about to embark on the strongest part of wave 5, which began in February 2018. The fundamental justification can be summarized as believing that the market swung too aggressively in pricing out FOMC hikes and into FOMC cuts, and normalization of this extreme view may lead to USD strength.
The big idea behind why the market would start to price in a strong US Dollar has mainly to do with the recent US Dollar weakness that began on December 14 on the market’s belief that the Fed will pull way back their expected rate hikes in 2019, and may even cut to support the economy.
There is one problem with this view though. The Fed is still expecting to hike twice though Powell recently noted a needed ‘patience’ in understanding the data, and what it means for whether the economy can withstand more hikes.
I argue that a key factor or main reason why the economy has shifted to this view is likely transitory factors like the US-China Trade War, which if a ‘truce’ is obtained, could lead to the Fed reaffirming their two+ hike view in 2019.
Ironically, the weakening backdrop that has encouraged the Fed to push back their rate hike bets has aligned with an incredible bounce of the SPX500. Since the close December 24, the SPX500 has jumped 11.6%, and more could be on the way on further US Dollar weakness. The SPX500 strength can be labelled under FOMO, but the environment that it is built upon seems shakier than ever as a weaker US Dollar would likely only result from a backdrop that leads to materially weaker revenue outlooks for constituents of the index.
Put simply, I would argue that the end of the world is overstated, and when positive developments return and the Fed pricing returns to rate normalization (i.e., hikes) that the US Dollar will resume the rally it began in February.
What is IG Client Sentiment Saying?
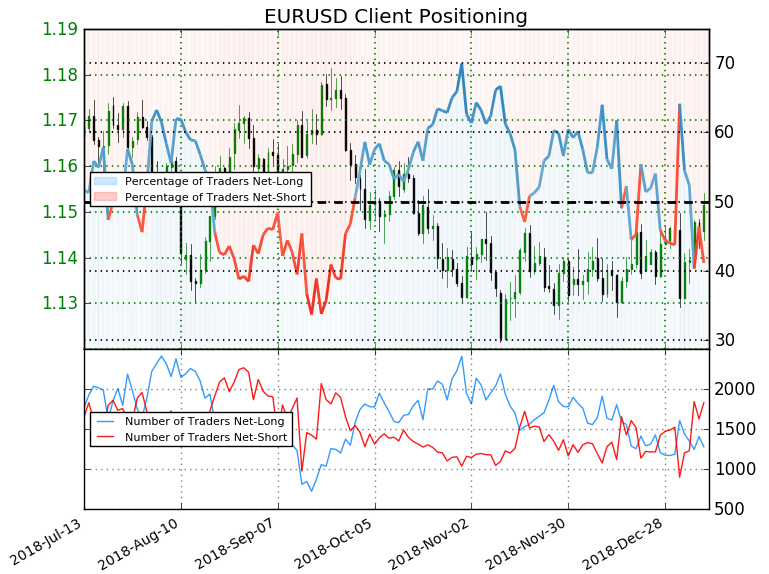
Source: IG Client Sentiment
For EURUSD,IG Client Sentiment retail trader data shows 41.1% of traders are net-long with the ratio of traders short to long at 1.43 to 1. Please note, EUR/USD is utilized as it makes up 56.8% of the DXY, and the sentiment picture can provide deep insight to the outlook of DXY.
We typically take a contrarian view to crowd sentiment, and the fact traders are net-short suggests EURUSD prices may continue to rise. Traders are further net-short than yesterday and last week, and the combination of current sentiment and recent changes gives us a stronger EURUSD-bullish contrarian trading bias(emphasis mine.)
The reason I share this with you is that it seems to indicate that Dollar weakness could continue in the near-term. You’ll notice the long entry order is below current market on the Dollar Index so IGCS appears to be showing that we could see the entry order triggered with a relatively tight stop loss relative to the expected profit targets.
FOREX TRADING RESOURCES TO SUPPORT YOUR STRATEGY
We hope you enjoy DailyFX’s new podcast: Trading Global Markets Decoded
DailyFX offers a surplus of helpful trading tools, indicators, and resources to help traders. For those looking for trading ideas, our IG Client Sentiment shows the positioning of retail traders with actual live trades and positions.
Our trading guides bring our DailyFX Quarterly Forecasts and our Top Trading Opportunities, and our real-time news feed has intra-day interactions from the DailyFX team. And if you’re looking for real-time analysis, our DailyFX Webinars offer numerous sessions each week in which you can see how and why we’re looking at what we watch.
If you’re looking for educational information, our New to FX guide is there to help new(er) traders while our Traits of Successful Traders research is built to help sharpen the skill set by focusing on risk and trade management.
---Written by Tyler Yell, CMT
Tyler Yell is a Chartered Market Technician. Tyler provides Technical analysis that is powered by fundamental factors on key markets as well as trading educational resources. Read more of Tyler’s Technical reports via his bio page.
Communicate with Tyler and have your shout below by posting in the comments area. Feel free to include your market views as well.
Talk markets on twitter @ForexYell


