NZDUSD price analysis and outlook:
- The NZDUSD price looks to have broken to the downside from an ascending triangle chart pattern in place since early December last year.
- Coupled with a bearish reading from IG Client Sentiment data, that suggests further losses for the pair.
NZDUSD price outlook bearish
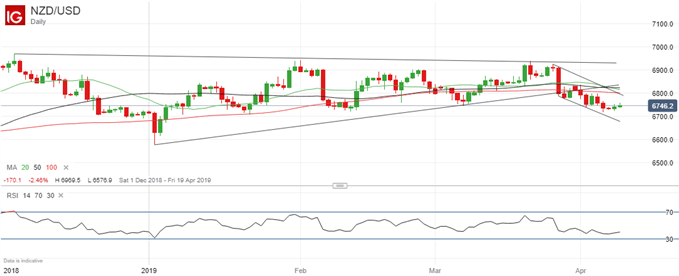
The NZDUSD price has broken to the downside from an ascending triangle pattern on the daily chart, suggesting further losses to come. As the chart below shows, the pattern has been in place since early December 2018, with the breakout occurring late last month. In the last few sessions the price seems to have stabilized but further losses from here would be no surprise.
NZDUSD Price Chart, Daily Timeframe (December 3, 2018 – April 9, 2019)

Chart by IG (You can click on it for a larger image)
The key levels to watch out for now are the low at 0.6719 touched on April 5, with a drop below leading potentially to a fall to under 0.67, where the support line of the new downward channel checks in. To the upside, the April 2/3/4 highs at 0.68 should provide resistance. Beyond that there is further resistance at the 20-day moving average at 0.6815 and the 50 dma at 0.6823.
The 0.68 level is the key upside level to watch, not just because the early April highs were there but also because the resistance line of the new downward channel checks in there, as does the 100 dma.
IG client sentiment data bearish
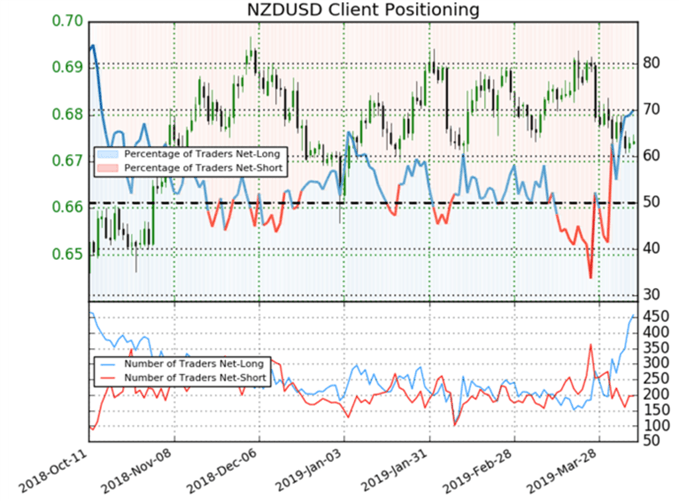
Turning to sentiment, data from IG – DailyFX’s parent company – show a surge in the number of retail traders net-long NZDUSD. The figures show 69.9% of traders are net-long, with the ratio of traders long to short at 2.32 to 1. The number of traders net-long is 19.6% higher than yesterday and 107.7% higher than last week, while the number of traders net-short is 10.1% higher than yesterday and 22.4% lower than last week.
At DailyFX, we typically take a contrarian view to crowd sentiment, and the fact traders are net-long suggests the NZDUSD price may continue to fall. Traders are further net-long than yesterday and last week, and the combination of current sentiment and recent changes gives us a stronger NZDUSD-bearish contrarian trading bias.

If you’d like to learn more about how to identify trends using trader sentiment data, listen in to my webinar tomorrow at 1130 GMT. You can sign up here
More resources to help you trade the forex markets:
Whether you are a new or an experienced trader, at DailyFX we have many resources to help you:
- Analytical and educational webinars hosted several times per day,
- Trading guides to help you improve your trading performance,
- A guide specifically for those who are new to forex,
- And you can learn how to trade like an expert by reading our guide to the Traits of Successful Traders.
--- Written by Martin Essex, Analyst and Editor
Feel free to contact me via the comments section below, via email at martin.essex@ig.com or on Twitter @MartinSEssex


