


GBPUSD technical analysis:
- GBPUSD remains under downward pressure.
- However, in the near-term, a rally is possible after a moving average crossover on the five-minute chart.
Check out the IG Client Sentiment data to help you trade profitably.
Near-term rally possible for GBPUSD
GBPUSD remains under downward pressure after the latest UK inflation data reinforced the view that the Bank of England will likely leave UK bank rate unchanged next week and the UK Government continues to struggle to push its Brexit legislation through the UK Parliament.
Medium-term, the technical outlook is poor too. However, in the near-term, some upside is possible after the 20-period moving average on the five-minute chart rose above the 100-period moving average. The 50-period moving average is close to climbing above it too, a move that would confirm a near-term upward trend.
GBPUSD Price Chart, Five-Minute Timeframe (June 12 – 13, 2018)
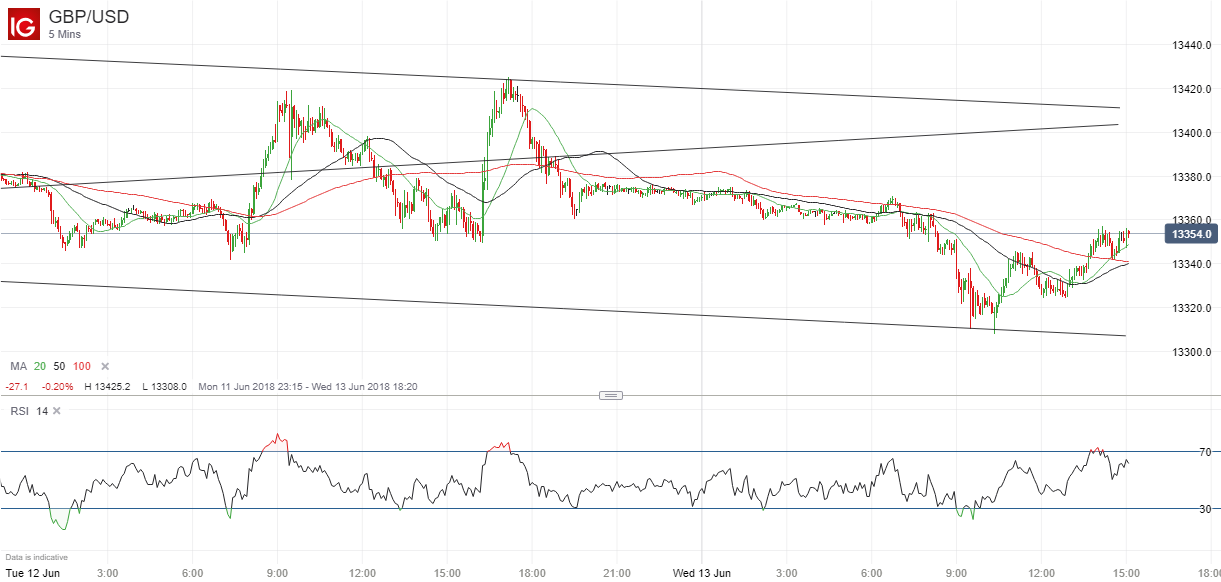
Any such move would likely stall around the 1.3400/10 level, where resistance lies from two longer-term trendlines. Tuesday’s high at 1.3425 could also be difficult to overcome but a rise up to those levels cannot now be ruled out.
Meanwhile, to the downside, there is support at 1.3308, the low so far this session, and also just below that where trendline support lies. On the five-minute chart above, the pair is close to overbought levels on the 14-day relative strength index (RSI) but is not there yet, adding to the likelihood of a mini rally.
Longer term, GBPUSD May Fall Further After In-Line UK Inflation Data
Resources to help you trade the forex markets
Whether you are a new or an experienced trader, at DailyFX we have many resources to help you: analytical and educational webinars hosted several times per day, trading guides to help you improve your trading performance, and one specifically for those who are new to forex. You can learn how to trade like an expert by reading our guide to the Traits of Successful Traders.
--- Written by Martin Essex, Analyst and Editor
Feel free to contact me via the comments section below, via email at martin.essex@ig.com or on Twitter @MartinSEssex


