


EUR/CHF Technical Forecast
- Bullish Outlook
- Waiting for more signals
Check our latest Q4 forecasts for free and learn what is likely to move the markets at this time of the year.
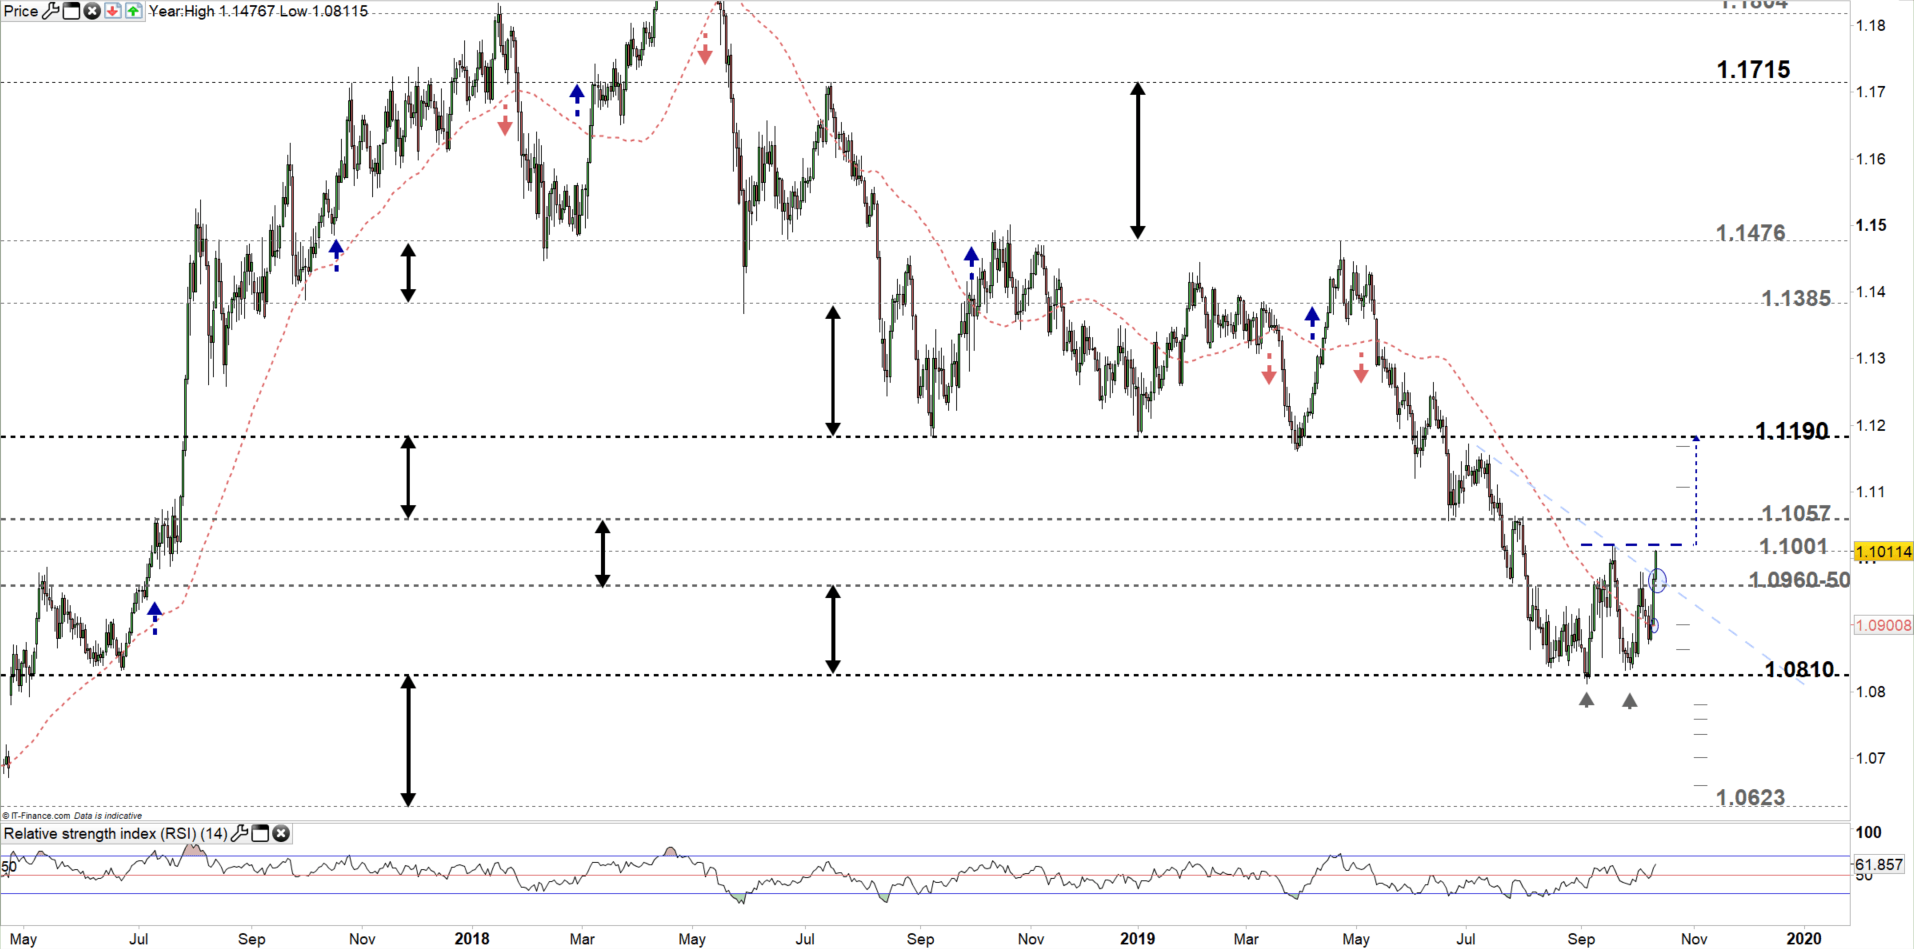
EUR/CHF Daily Price Chart (March 1, 2017 – Oct 11, 2019) Zoomed Out
Just getting started? See our Beginners’ Guide for FX traders
EUR/CHF Daily Price Chart ( March 31 – Oct 11, 2019) Zoomed IN
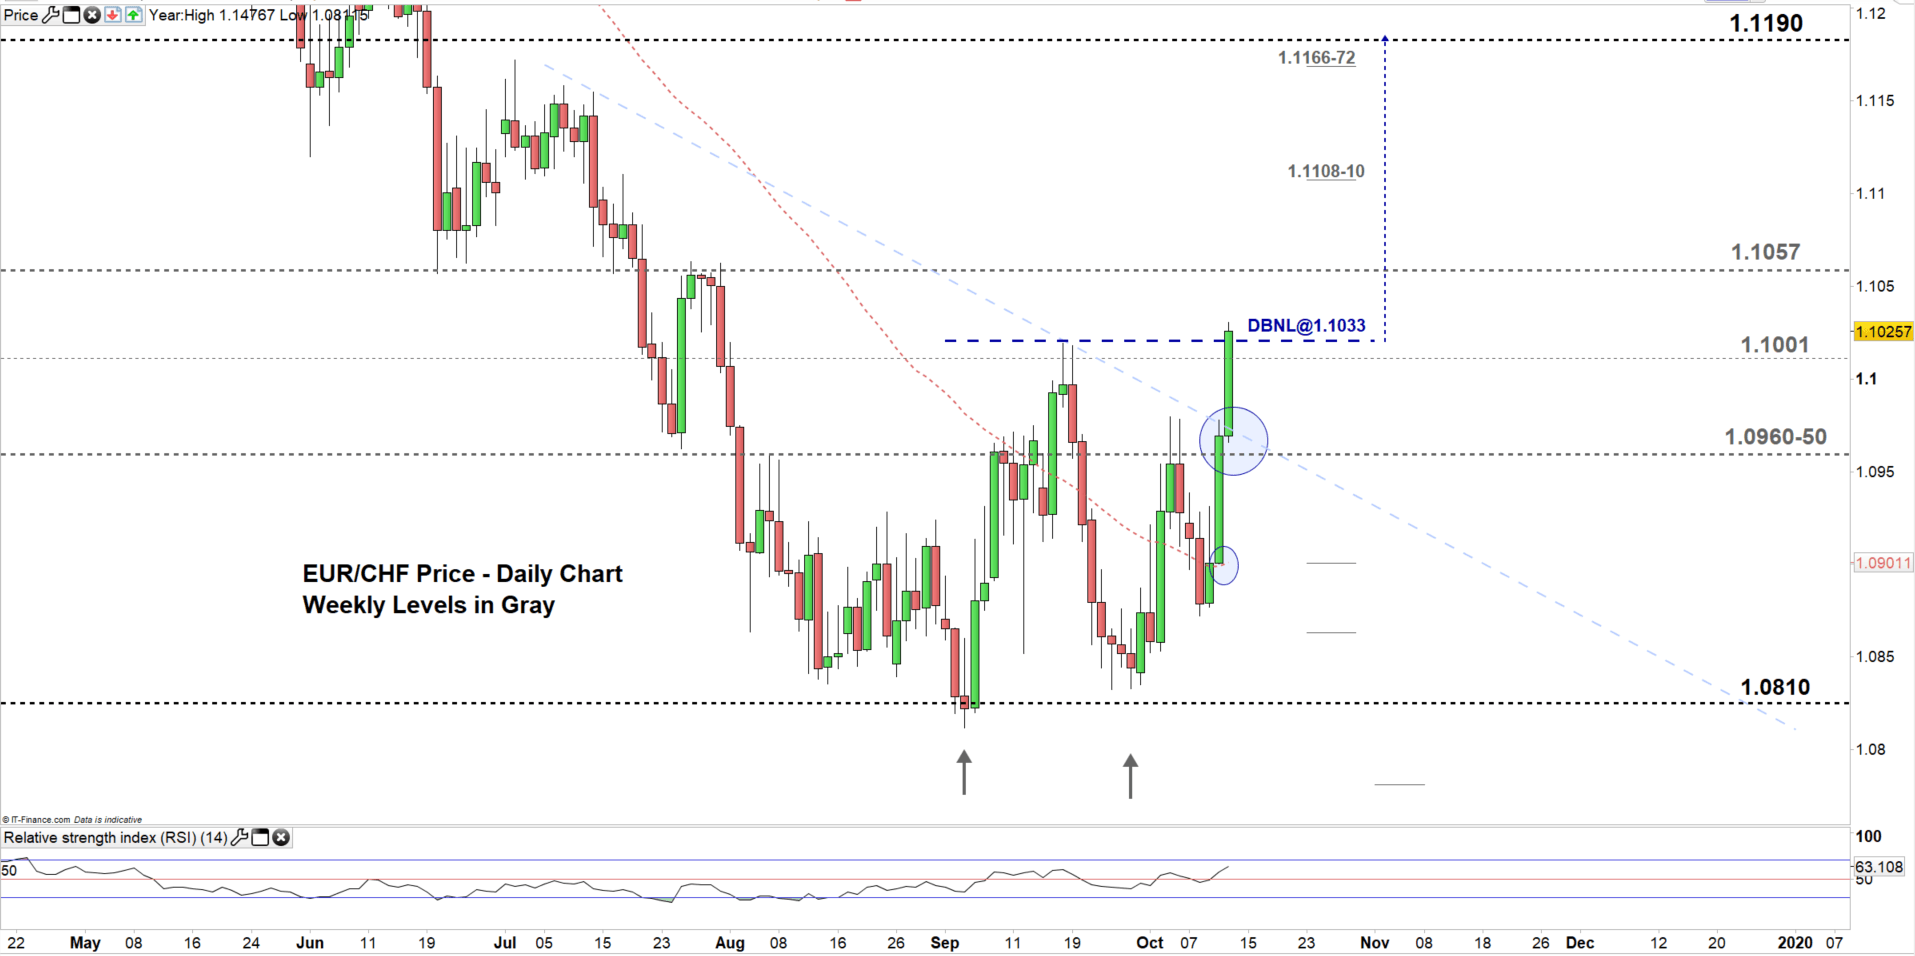
From the daily chart we notice, EUR/CHF has started uptrend move on Sep 27 creating higher highs with higher lows. Yesterday, the pair closed above the 50-day average giving a bullish signal. Today, the pair broke above the uptrend line originated form the July 12 high at 1.1154 providing an additional bullish signal.
Currently, the pair is facing the low end of the trading zone 1.1001 – 1.1057. A close above this level could push EURCHF towards the high end.
Worth mentioning, the pair eyes at the moment the neckline of double bottom pattern (reversal formation) residing at 1.1033. Thus, subject to a close above the aforementioned neckline, a bullish bias could lead EURCHF towards 1.1190. Nevertheless, close attention should be paid to the weekly resistance areas marked on the chart (zoomed in)
Having trouble with your trading strategy? Here’s the #1 Mistake That Traders Make
Written By: Mahmoud Alkudsi
Please feel free to contact me on Twitter: @Malkudsi


