


After a strong sell off in 2013-2015, AUD/USD began to consolidate those losses in September 2015. During that time, we have seen open interest in trading the pair slowly drift lower as the trend quieted down.
For the past 3 months, AUDUSD has quietly carved two bearish patterns in a row which offers an opportunity to position short.
Market Interpretation: Retracement
Entry: Near .7520 - .7600
Stop Loss:Near .7680 (-80 to -160 pips)
First Target: .7000 (+520 pips)
Second Target: .6500 (+1,020 pips)
There are 3 charts below that work off one another.
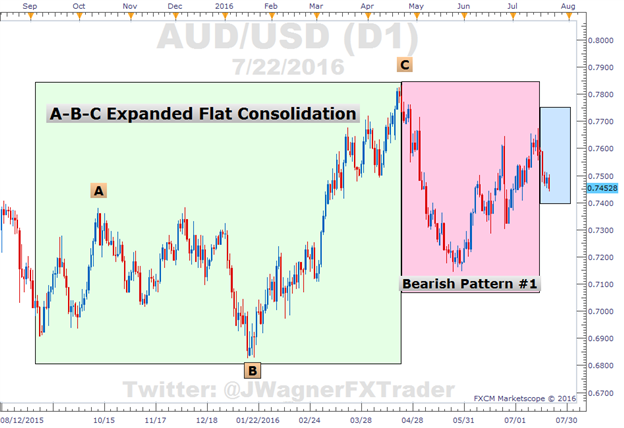
First, we can see on the daily chart below, from September 2015 to April 2016, AUDUSD carved an A-B-C expanded flat correction higher. It is an Elliott Wave pattern that suggests the whole pattern is likely to be retraced at some point in time in the future.
Secondly, as price chopped through the A-B-C correction, open trading interest in the pair plummeted. Traders typically try to pick tops and bottoms. However, they also tend to chase after tops in bottoms in strong trends. As AUD/USD consolidated, their interest in trading the pair waned.
AUDUSD Open Interest Quiets Down

Then, beginning April 21, 2016, an impulsive wave formed to the downside followed by a three wave corrective move higher. This 5-3 wave combination, especially when it starts a new trend, can be a good pattern to trade strong risk to reward ratio opportunities from.
We highlighted this bearish potential on June 27. That is the first bearish pattern that suggests lower prices to retest .70 if not lower.
Now, from the July 14 high, it appears we are in the latter stages of another smaller degree 5-3 bearish pattern. If this outlook holds, then AUD/USD would be at risk of falling hard in a 3rd of 3rd wave lower. Third waves tend to be the longest and strongest of the Elliott Wave sequence. So it is a force that is recognized when it occurs.

Therefore, we’ll use any bullish strength into .7520 to .7600 (see above) as an opportunity to short the pair. Other commodity currency pairs like NZD/USD may follow suit as well.
So the first bearish pattern carved from April 21 – July 14. The second bearish pattern is in its final stages with a bump higher.
This trading opportunity includes a positive risk to reward ratio as we are risking 160 pips to target 520 pips (first target). We discuss this as one of our Traits of Successful Traders Learn More here.
Interested in a quarterly outlook for USD? Download our quarterly forecast here.
---Written by Jeremy Wagner, Head Trading Instructor, DailyFX EDU
Follow me on Twitter at @JWagnerFXTrader .
See Jeremy’s recent articles at his Bio Page.
To receive additional articles from Jeremy via email, join Jeremy’s distribution list.


