


EUR/USD has increased about 100 pips today as Fed Chairwoman Janet Yellen sung a dovish tune. That sent US Dollar weak vibes through the markets and the EUR/USD exchange rate took off for higher levels.
Retail traders were looking to sell the rally as short interest continued to increase while the pair traded higher. There are 11.8% more short traders today than on record yesterday. Additionally, the bullish traders are reducing in number as the long positions are 15.8% fewer than yesterday. This sets up a long trading opportunity to buy EUR/USD. (See real time trader positioning here.)
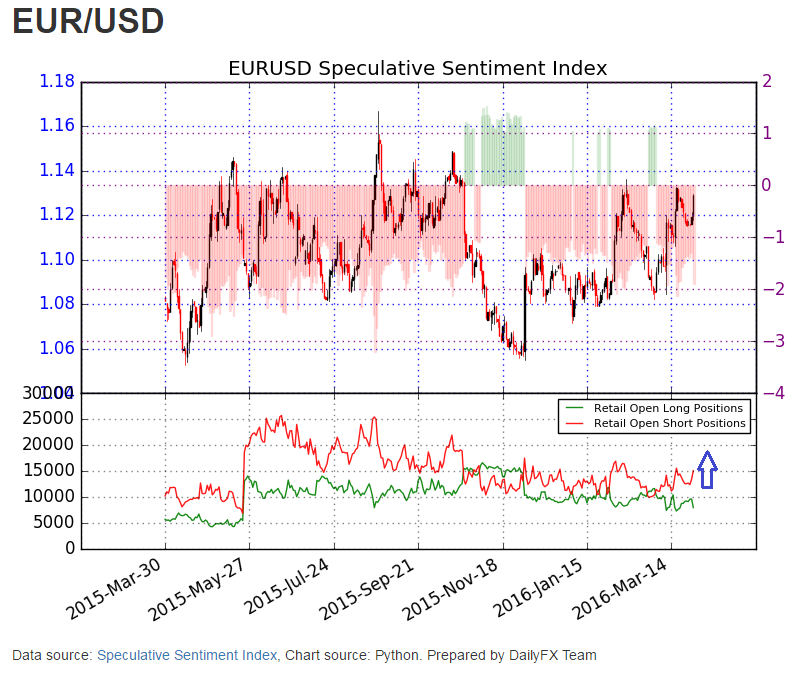
[Image 1]
Assessing the technical picture for the pair, it appears higher levels may continue towards 1.1460 and possibly 1.1650. Therefore, we will look to initiate a breakout trade above the March 17 high of 1.1343.
Market Interpretation
Market Condition: Breakout
Bias: Long EUR/USD
Entry: Near 1.1345
Stop Loss: Near 1.1160 (-185 pips)
First Target: Near 1.1460 (+115 pips); then move the stop loss to breakeven
Second Target: 1.1650 (+305 pips)
EUR/USD Tests Resistance

[Image 2]
In the chart above, the higher probability wave picture is that we are in a 5 wave ‘C’ wave higher that may eventually retest 1.17. ‘C’ waves subdivide in 5 waves (except for in triangles). Therefore, it appears this ‘C’ leg is taking the shape of an ending diagonal pattern.
Based on the wave picture above, it appears we are in the midst of the third wave of this 5 wave structure higher. Therefore, there appears to be more room for prices to run higher. (See idealized image below)

[Image 3]
There is a bearish pattern outside of the ending diagonal that may take us down the 1.10 handle. However, a breakout above 1.1343 lessens the probability of the break down.
Still not sure about the direction of the EUR/USD? Consider downloading and reading our EUR and USD quarterly forecasts available here.
We’ve researched millions of trades and found that almost half of the traders (43%) turned a profit when implementing this simple technique that every trader has control over. Learn more about that tweak in pages 13-14 of the Traits of Successful Traders Guide [free registration].
To receive additional picks or articles on using Elliott Wave Theory, join Jeremy’s distribution list.


