

AUD/JPY TRADING Strategy: BEARISH
- Bearish Engulfing candle pattern on AUD/JPY weekly chart hints at weakness
- Deterioration in the RBA policy outlook offering sellers fundamental backing
- Confirmation of a breakdown initially exposes support below the 74.00 figure
The Australian Dollar may be preparing to resume the downward trend guiding it lower against the Japanese Yen since mid-September 2017. The currency mounted a spirited recovery in the second half of 2019, lifting it off decade lows to retest pace-setting resistance.
A Bearish Engulfing weekly candlestick pattern at this barrier now suggests that a corrective rebound is coming to an end as the dominant bearish bias is re-asserted. Breaking below upward-slowing support in play since early August – now just below 75.00 – may add urgency to the case for weakness.
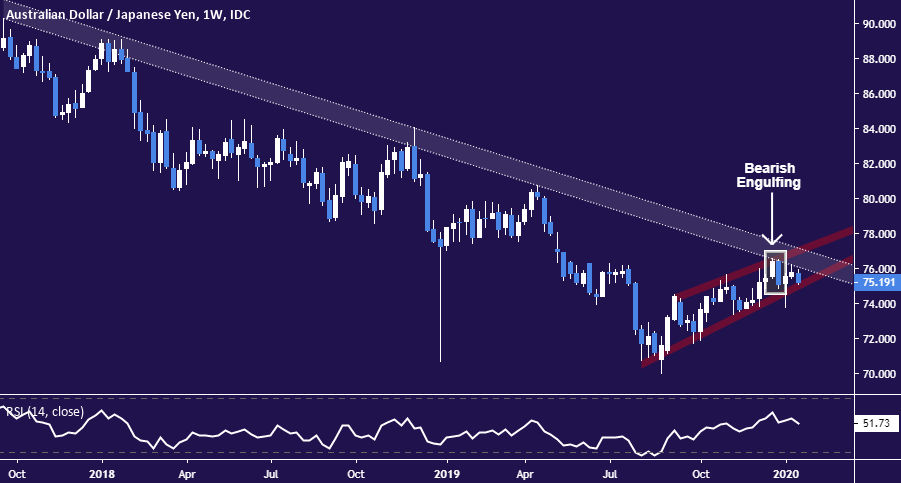
AUD/JPY weekly chart created with TradingView

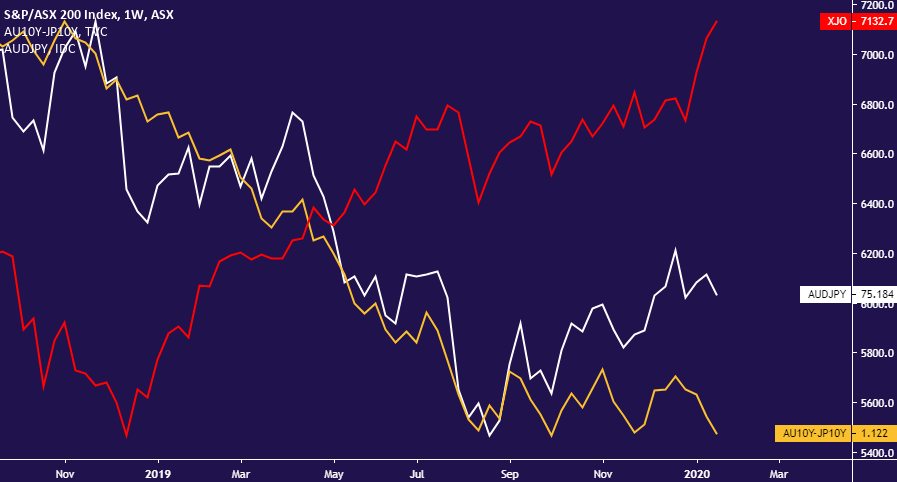
A dovish shift in the outlook for RBA monetary policy establishes the fundamental backdrop. A steep downshift in Australia-Japan 10-year government bond yield spread reflected a defensive pivot from the central bank. Tellingly, hopes for easing also lifted Australia’s benchmark S&P/ASX 200 index.
The rebound in market-wide risk appetite in the fourth quarter encouraged carry trade demand and lifted AUD/JPY, but the underlying return stream has hardly improved. Indeed, the Aussie’s yield advantage now stands within a hair of multi-year lows set four months ago.
AUD/JPY weekly chart created with TradingView
That may take center stage if sentiment falters. This is an ever-present concern as traders juggle a multitude of diverse risks, from the outcome of the US presidential election to swelling tensions in the Middle East and a worrying coronavirus outbreak.
Zooming into the daily chart for a timelier look, the 73.36-76 appears to mark initial support if the bounds of the near-term uptrend give way. On the topside, long-term trend resistance is reinforced by a horizontal barrier in the 76.16-55 zone that has capped gains since May.

AUD/JPY daily chart created with TradingView
AUD/JPY TRADER SENTIMENT
| Change in | Longs | Shorts | OI |
| Daily | 20% | -1% | 4% |
| Weekly | 6% | -5% | -3% |
AUD/JPY TRADING RESOURCES
- Just getting started? See our beginners’ guide for FX traders
- Having trouble with your strategy? Here’s the #1 mistake that traders make
- Join a free live webinar and have your trading questions answered
--- Written by Ilya Spivak, Currency Strategist for DailyFX.com
To contact Ilya, use the comments section below or @IlyaSpivak on Twitter