


USD/JPY TRADING Strategy: BEARISH
- Support break hints USD/JPY is resuming a 13-month downtrend
- First key support eyed below 107 figure, clearing 110 invalidates
- Broad-based trend dynamics hint at scope to challenge below 103
Get help building confidence in your USD/JPY strategy with our free trading guide!
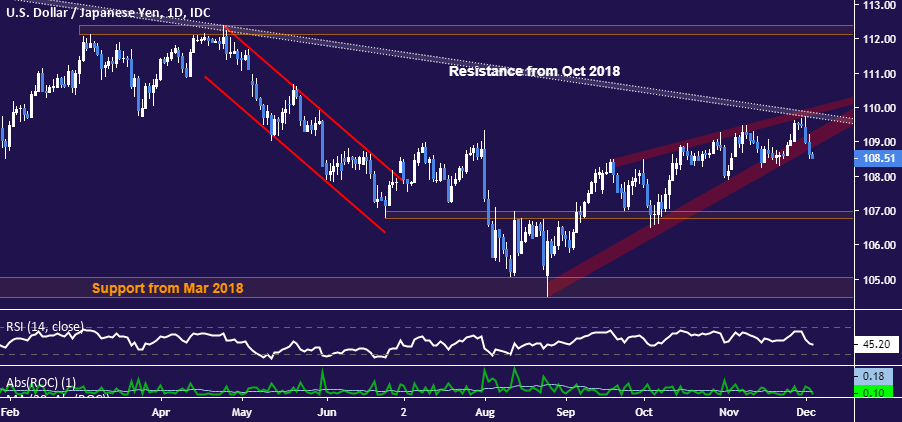
USD/JPY looks to be resuming a 13-month downtrend following a corrective upswing from late-August lows. Prices recoiled from trend-defining resistance set from October 2018 to breach support defining the bounds of the three-month rise and marking the bottom of a bearish Rising Wedge chart pattern.
This suggests sellers are back in control. The next major layer of support seems to line up in the 106.78-96 area. Breaking below that on a daily closing basis sets the stage to challenge the 104.46-105.05 support shelf, a barrier in play since March 2018.
This too might give way. Setting aside the wild spike low registered in December 2018, prior trend dynamics imply scope for a move down of about 6.5 percent in the event of bearish resumption. That threatens to put prices south of the 103.00 figure in the weeks and months ahead.
Daily USD/JPY chart created with TradingView
The underside of the Wedge pattern has been recast as resistance and now establishes the initial upside hurdle. However, reclaiming a firm foothold above the 110.00 figure – and thereby breaking the October 2018 trend line – is probably a prerequisite to truly neutralize selling pressure.
USD/JPY TRADING RESOURCES
- Just getting started? See our beginners’ guide for FX traders
- Having trouble with your strategy? Here’s the #1 mistake that traders make
- Join a free live webinar and have your trading questions answered
--- Written by Ilya Spivak, Currency Strategist for DailyFX.com
To contact Ilya, use the comments section below or @IlyaSpivak on Twitter


