


AUD/JPY TECHNICAL STRATEGY: BEARISH
- AUD/JPY has been congesting between 79.055-79.899
- A break below (if GDP data misses) may signal reversal
- Otherwise, clearing resistance should need confirmation
See our free guide to learn how to use economic news in your trading strategy !
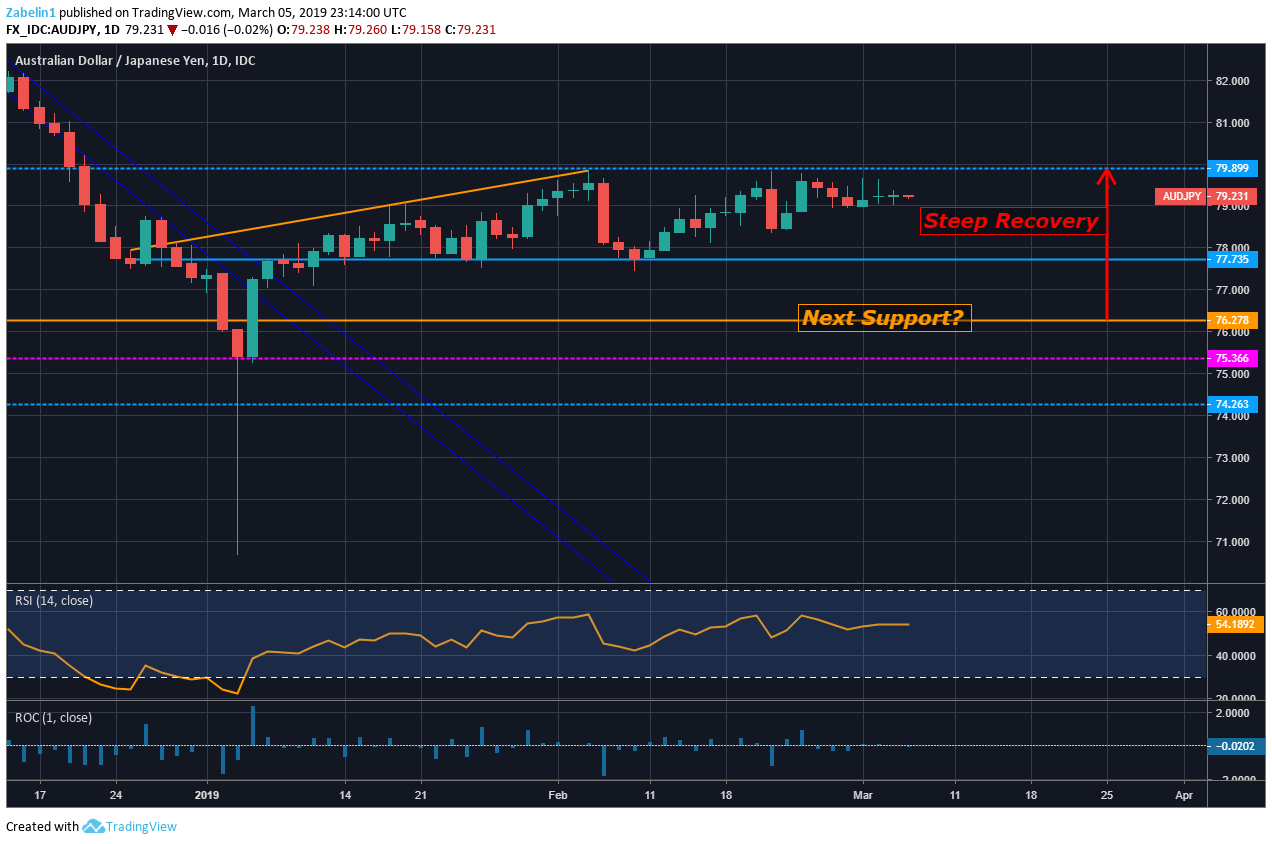
Since early January, AUD/JPY has been trading between the 74.263-79.899 range with doji-like candles potentially signaling investors’ uncertainty over upside momentum in the pair. It shied away from 79.899 on several occasions which may be an indicator that the pair is bumping up against a significant price roof. A break above this could be followed by a spike, but the duration and magnitude of such a jump are unknown.
AUD/JPY – Daily Chart

Conversely, a break below 77.735 might signal a strong bearish inclination and could push AUD/JPY down to the next possible floor at 76.278. If it reaches this support, attempts at breaching key resistance at 79.899 might be akin to pushing a boulder up a hill.
AUD/JPY – Daily Chart
The range-bound character of the pair may be tested as we come up to the release of Australian GDP. Click here to register for live coverage of the data and the market reaction. If it undershoots estimates, the pair could drop below 77.735.
AUD/JPY TRADING RESOURCES
- Join a free Q&A webinar and have your trading questions answered
- Just getting started? See our beginners’ guide for FX traders
- Having trouble with your strategy? Here’s the #1 mistake that traders make
--- Written by Dimitri Zabelin, Jr Currency Analyst for DailyFX.com
To contact Dimitri, use the comments section below or @ZabelinDimitri on Twitter


