


USD/BRL Technical Strategy: PENDING SHORT AT 3.5843
- Waiting for USD/BRL to have daily close below 3.5843 to confirm reversal
- Decline is likely to accelerate after a daily close below the neckline support
- The next possible support level will possibly be at the 3.3377 price target
See our free guide to learn how to use economic news in your trading strategy !
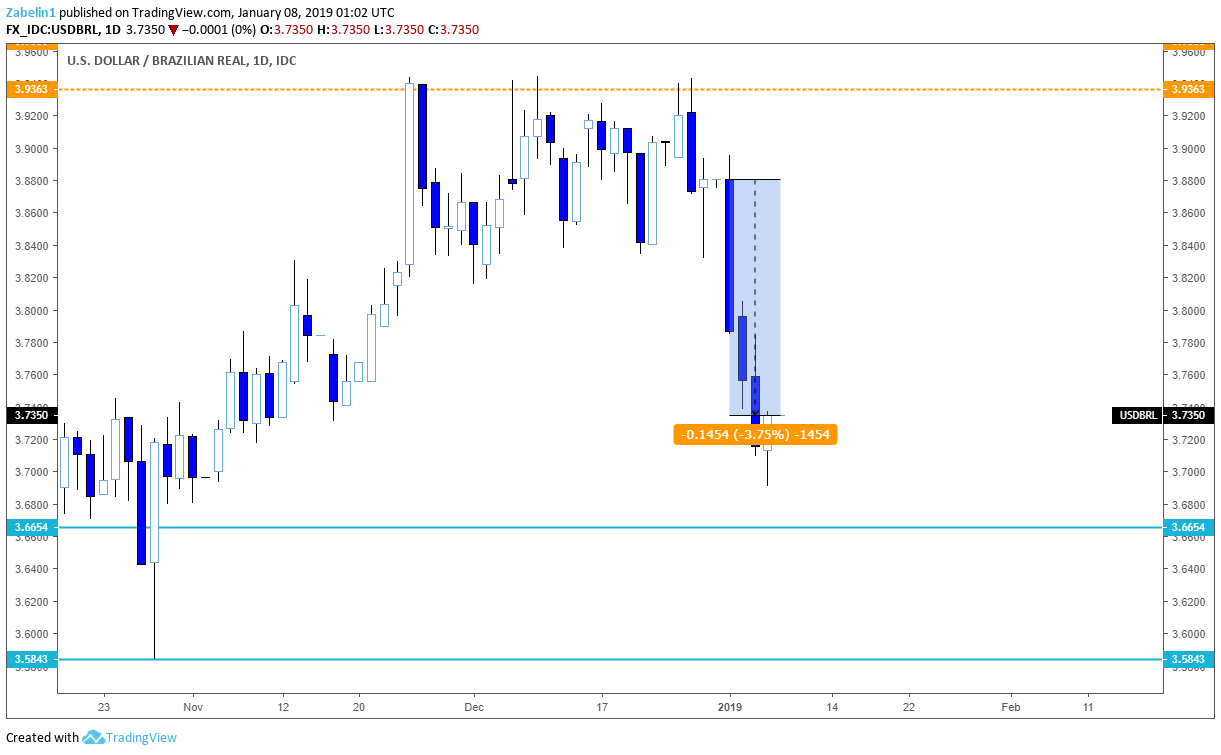
After returning from the holidays, USD/BRL dropped over 2% from its previous close at 3.8804 on December 31 to 3.7867 on January 2. The pair since have declined 3.75 percent, closing at 3.7350 on January 8.
USD/BRL, Post-Holiday Drop – Daily Chart
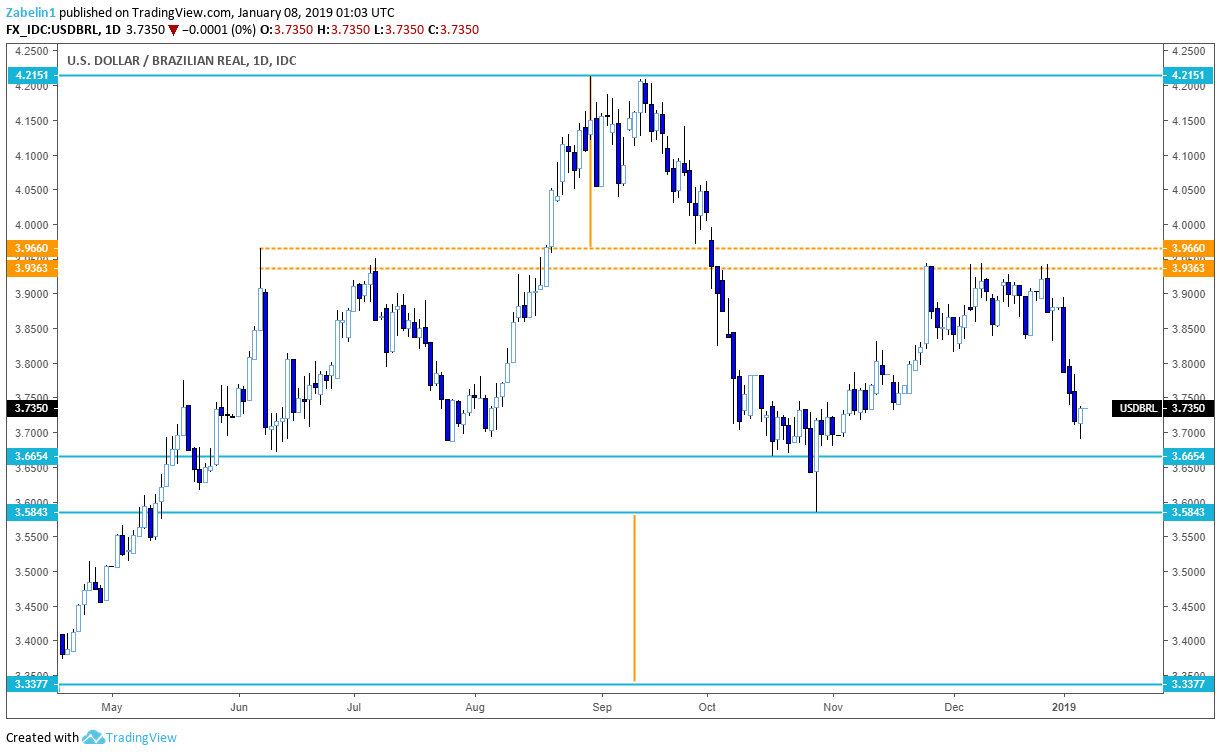
Since early June, the pair have been forming what is resembling a Head and Shoulders bearish reversal pattern. The substantial downward move was a boon for USD/BRL bears after the pair lazily drifted in forming what is increasingly looking like the second shoulder. This came after several attempts the market made at breaching the 3.9363-3.9660. Ultimately, the failure to launch past it diminished investors’ optimism for a near-term uptrend in the pair.
USD/BRL Head and Shoulders Formation – Daily Chart
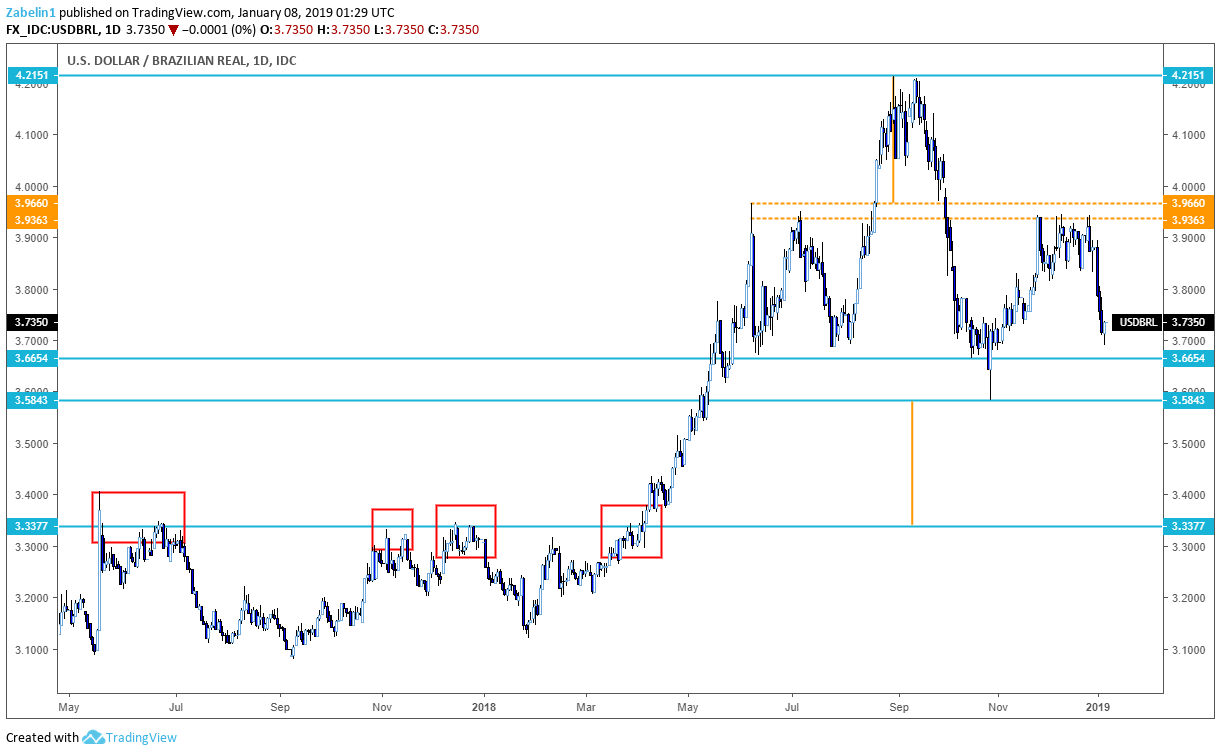
The pair appear to be approaching the upper layer of the neckline at 3.6654, but downward momentum may not be sufficient enough to immediately break below the lower level range at 3.5843. They may trade between this range for a brief period as investors test the pair’s bearish resolve.
A prudent approach to this setup might be to wait for a break beneath the 3.5843 support and hold steady until the pair see a daily close beneath the range. Were this to occur, and the downtrend to continue, the next possible support will be at the price target at 3.3377. Not likely a coincidence, but this also happens to be what looks like former resistance that was tested between June 2017 and April 2018.
USD/BRL Support Levels – Daily Chart
USD/BRL TRADING RESOURCES
Join a free Q&A webinar and have your trading questions answered
Just getting started? See our beginners’ guide for FX traders
Having trouble with your strategy? Here’s the #1 mistake that traders make
--- Written by Dimitri Zabelin, Jr Currency Analyst for DailyFX.com
To contact Dimitri, use the comments section below or @ZabelinDimitri on Twitter


