


Japanese Yen, Majors-Based JPY Index, USD/JPY, Fed, BoJ, Falling Wedge – Analyst Pick
- Japanese Yen aiming higher, but broader downtrend holds
- USD/JPY may resume climb on monetary policy divergence
- The pair is trending lower, but a bullish Falling Wedge brews

The anti-risk Japanese Yen has been making a comeback against its major peers, likely bolstered by recent volatility in global stock markets. On the whole, however, the currency remains in a dominant downtrend since last year’s peak. On the chart below is a majors-based Yen index, which is fast approaching what may be a descending trendline from March 2020. If it holds, JPY could resume broader declines.
The pair that I am closely watching, especially from a fundamental standpoint, is USD/JPY. In the third-quarter fundamental forecast, I made the argument for being bullish on the currency pair – see link below. This is because I believe the Fed will be less-dovish compared to the BoJ in the long run as local inflationary pressures persist. This may keep US Treasury yields more attractive compared to prevailing rates in Japan.

Given that both the Greenback and the Yen carry anti-risk properties, the divergence between US and Japanese monetary policy arguably plays the key fundamental driver for the pair. Lately, USD/JPY has been trending lower as US 2-year government bond yields underperformed Japanese ones. In fact, the spread between US and Japanese 2-year rates has been aiming lower since late June.
Still, there are risks for USD/JPY to the downside. Rising Covid cases amid the more infectious Delta variant have been lowering global growth prospects, hence the recent drop in US Treasury rates. Locally, US vaccination rates are relatively elevated. That could help maintain the outlook for growth in the medium term. With that in mind, how does the technical landscape look like for USD/JPY?
Majors-Based Japanese Yen Index – Daily Chart
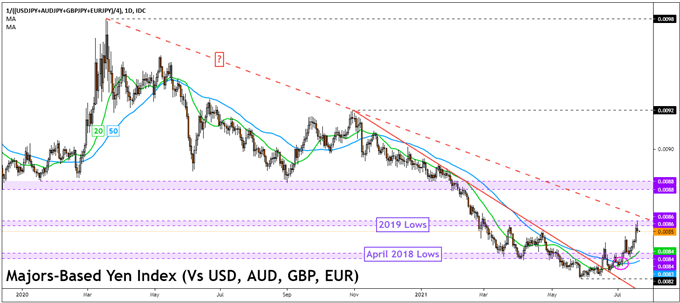
Chart Created in TradingView
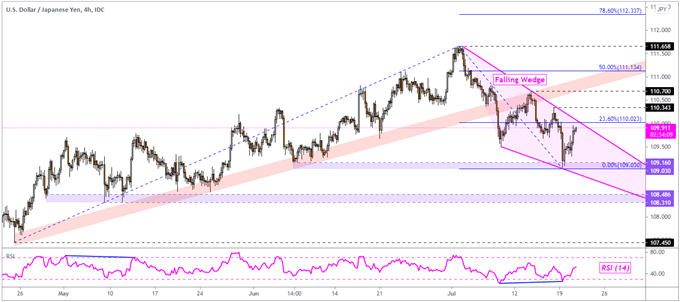
USD/JPY Technical Analysis
USD/JPY seems to be traversing within a bullish Falling Wedge chart pattern on the 4-hour chart. This does suggest that for the time being, July’s top continues to be in play, especially after the pair confirmed a breakout under rising support from April. The Yen is on the cusp of retesting the ceiling of the Falling Wedge. If it holds as key resistance, the 109.03 – 109.16 support zone could come back into focus. Otherwise, a breakout above the wedge may open the door to resuming the prior uptrend. That may pave the way for a retest of the July 2nd high at 111.658. Otherwise, clearing support opens the door to perhaps revisiting lows from May.
| Change in | Longs | Shorts | OI |
| Daily | -2% | 2% | 0% |
| Weekly | 12% | -16% | -6% |
USD/JPY – 4-Hour Chart
--- Written by Daniel Dubrovsky, Strategist for DailyFX.com
To contact Daniel, use the comments section below or @ddubrovskyFX on Twitter


