


USD/JPY Long Against Daily 8-EMA – Watch US Treasury Yields
Entry: At market
Stop: 112.70 (just below daily 8-EMA).
Target 1:114.15
Target 2:114.50 (May and July highs)
Timeframe: Several days to a few weeks
Chart 1: US Treasury 10-year Yield (March to October 2017)
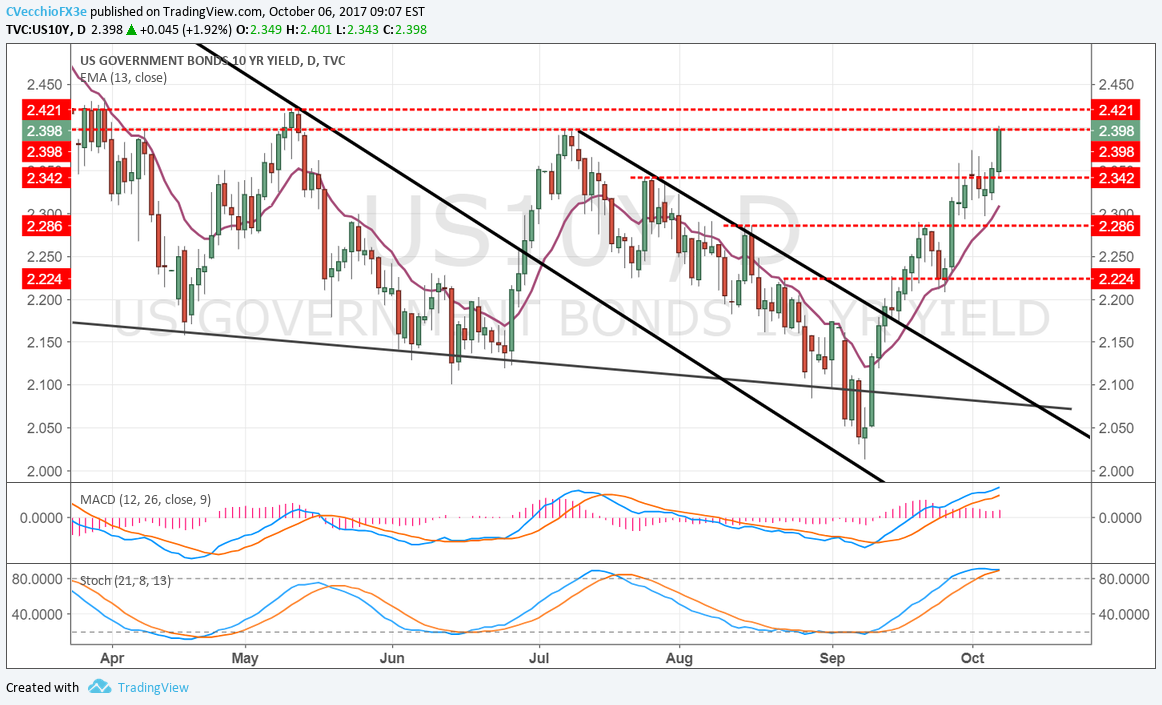
The US Treasury 10-year yield has risen to its highest level since July, in the process dragging up the US Dollar with it. For the greenback, rising interest rates benefit it particularly against the low yielding, safe haven currencies, whose central banks are employing zero or negative interest rate policies (ZIRP or NIRP). In turn, one of the main beneficiaries of the jump in US yields the past few weeks has been USD/JPY (the 20-day correlation between USD/JPY and the US Treasury 10-year yield is now +0.84).
From a technical perspective, the US Treasury 10-year yield appears to be well-supported by its daily 13-EMA, which it hasn’t closed below since September 12: there have been tests of, but no closes below this moving average in nearly four weeks. A close below the daily 13-EMA would signal that the recent burst higher in US yields is over, which would be a direct threat to any US Dollar bullishness.
Chart 2: USD/JPY Daily Timeframe (April to October 2017)
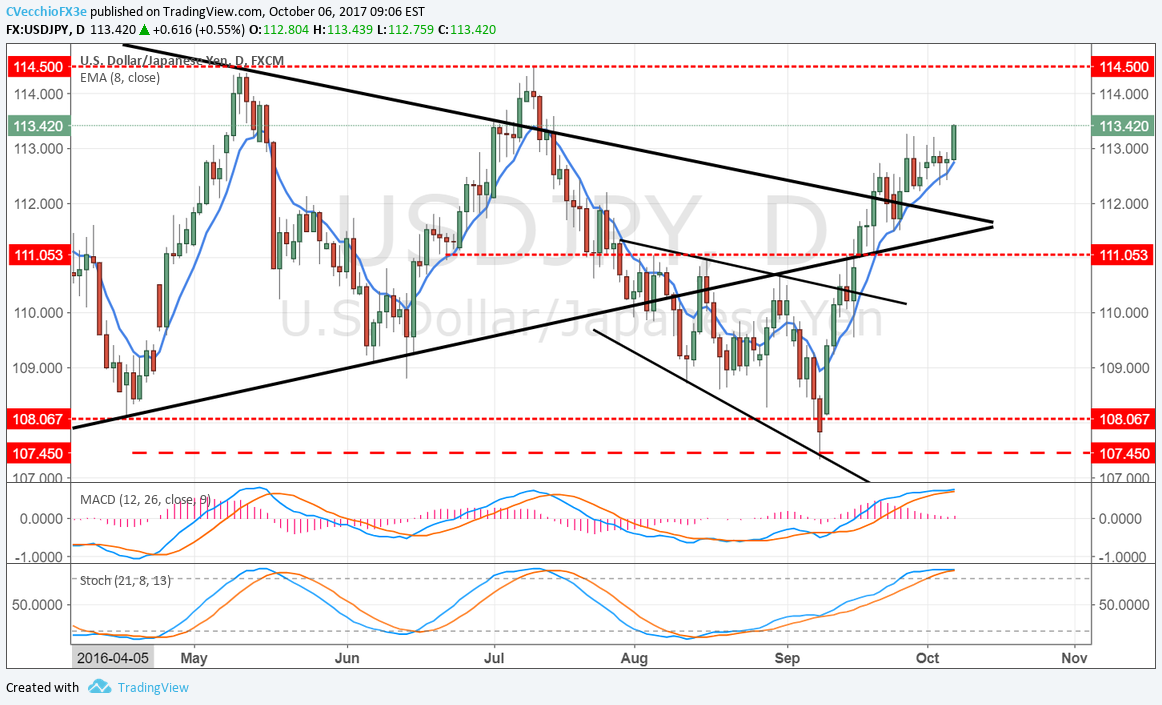
USD/JPY’s bullish posture remains intact after the first week of October, and in the near-term, the market has laid out a clearly defined level against which trades can be taken against. Price has held above the daily 8-EMA in USD/JPY since September 11: there have been tests of, but no closes below this moving average in nearly four weeks. A close below the daily 8-EMA would signal that the recent leg up in USD/JPY may be over.
EUR/USD Head & Shoulders Remains Valid
Position: Short EUR/USD
Entry: At market
Stop: 1.1863 (last week of September swing high)
Target 1:1.1554
Timeframe: Several days to a few weeks
Chart 3: EUR/USD 4-hour Timeframe (July 31 to October 5, 2017)

With a head at 1.2092 and a neckline at 1.1823, the EUR/USD topping pattern calls for an eventual move into the mid-1.1500s. With market participants realigning their views to match the Fed's expectations of another rate hike this year - there's now an 83% chance of a rate hike this year, up from 45% before the September FOMC meeting, according to Fed funds futures - the US Dollar's rally seems well-supported.
A further rise in rate expectations over the coming months, ultimately converging at 100% in December when the Fed actually raises rates, should be enough to keep EUR/USD's topping process in motion for the foreseeable future.
--- Written by Christopher Vecchio, CFA, Senior Currency Strategist
To contact Christopher Vecchio, e-mail cvecchio@dailyfx.com
Follow him on Twitter at @CVecchioFX
To be added to Christopher's e-mail distribution list, please fill out this form


