


US Dollar, Euro, British Pound, Australian Dollar, Japanese Yen – Price Action Setups:
- US Dollar might be readying to extend gains versus its peers
- EUR/USD eyeing wedge, GBP/USD to face a Double Top?
- AUD/USD rejects August higher, USD/JPY trendline breaks?

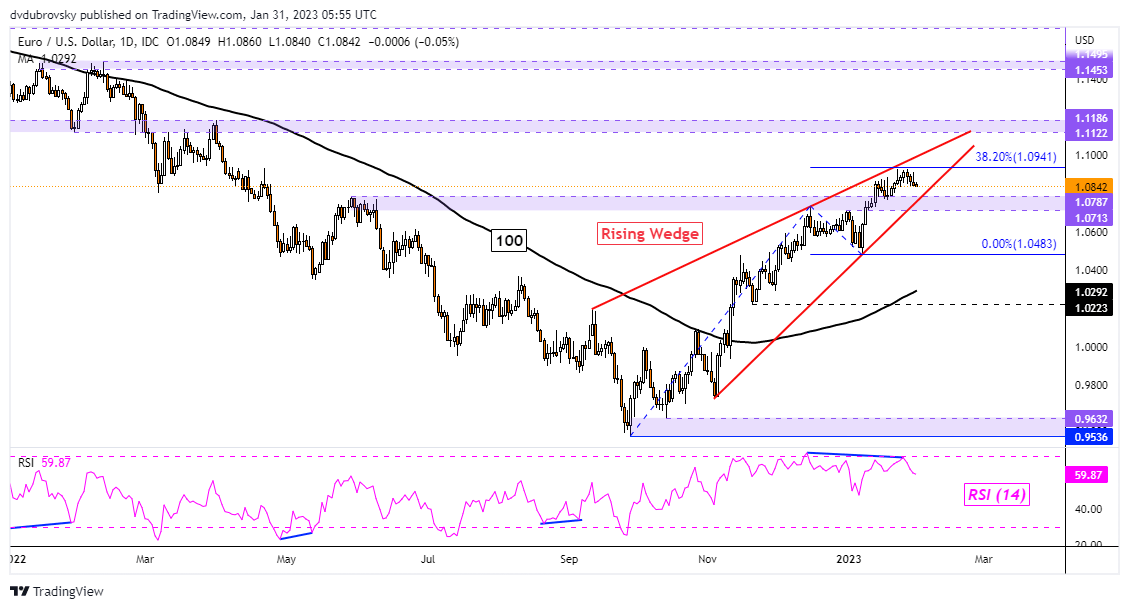
EUR/USD Daily Chart – Rising Wedge in Focus
The US Dollar has been gaining against the Euro in recent days. This follows EUR/USD testing the ceiling of a bearish Rising Wedge chart formation. Now, the pair is aiming toward the floor of the pattern. While the price trend may remain bullish within the wedge, a breakout below (1.0787 – 1.0713) would open the door to resuming the dominant downtrend from last year. Otherwise, pushing above the 38.2% Fibonacci extension at 1.0941 exposes the April 2022 high.
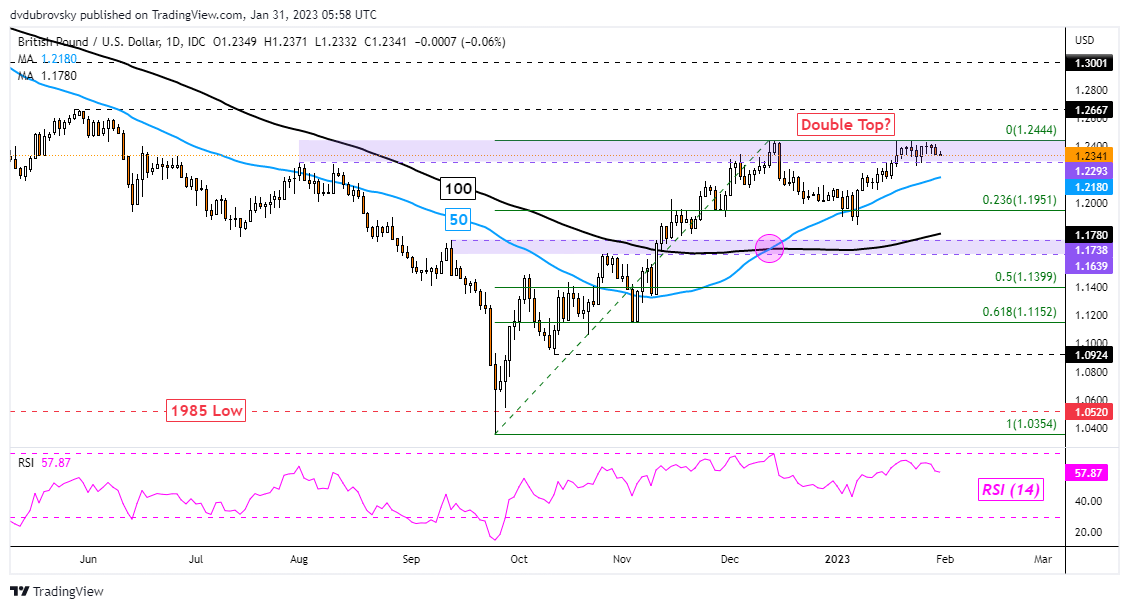
GBP/USD Daily Chart – Double Top to Emerge?
The US Dollar is trying to hold its ground against the British Pound after Sterling bounced back to the December high. This makes for a zone of resistance between 1.2293 – 1.2444. A turn back lower towards 1.1951 could see a bearish Double Top emerge. Confirming a breakout under 1.1951 would open the door to extending losses toward the 100-day Simple Moving Average (SMA). Otherwise, breaking above exposes the May 2022 high at 1.2667.
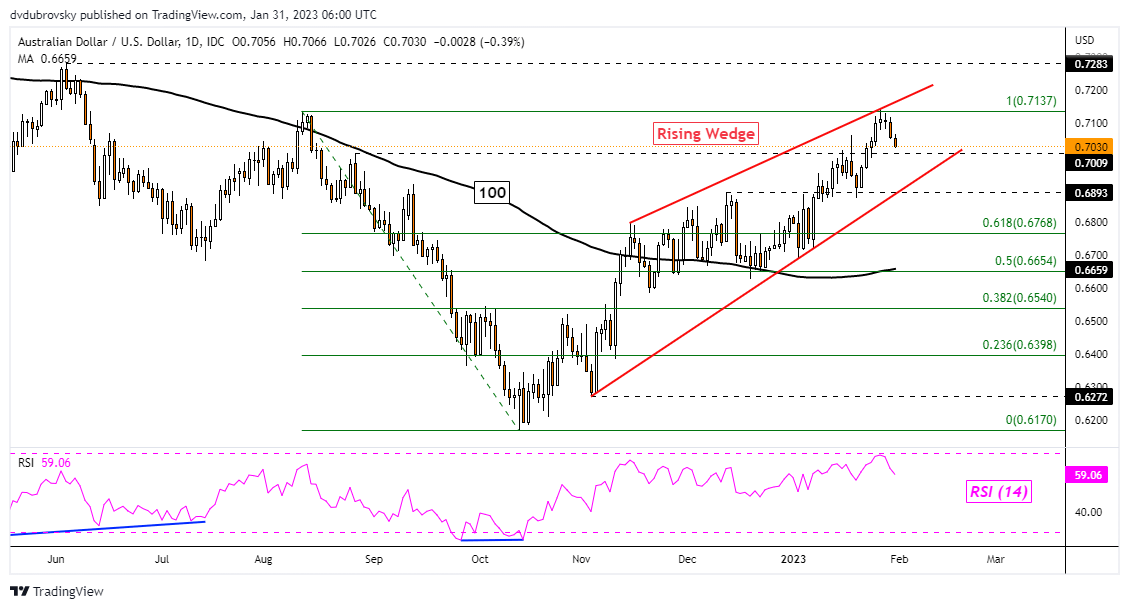
AUD/USD Daily Chart – Turning Lower to Rising Wedge Support?
The US Dollar is also turning against the Australian Dollar. In recent days, AUD/USD rejected the August 2022 high at 0.7137, falling back toward the floor of a bearish Rising Wedge. Like EUR/USD, the near-term outlook remains bullish as prices consolidate higher within the wedge. However, breaking lower would open the door to a reversal, exposing the 100-day SMA. Meanwhile, pushing above 0.7137 opens the door to revisiting the June 2022 high at 0.7283.

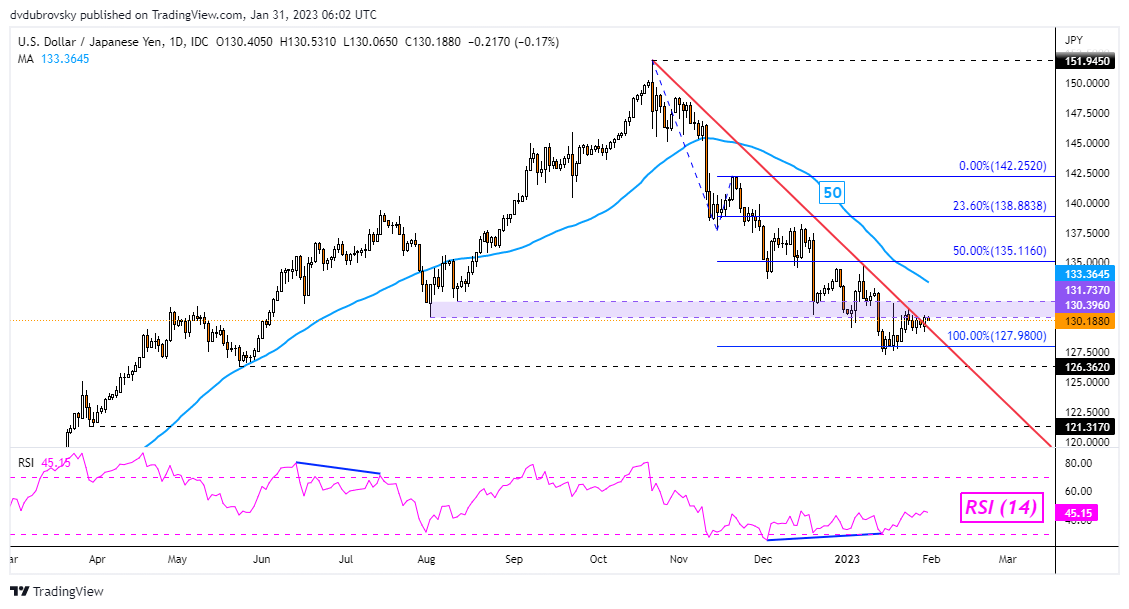
USD/JPY Daily Chart – Falling Trendline in Focus
The US Dollar might be readying to reverse higher against the Japanese Yen. That is because USD/JPY broke above the key falling trendline from October. Granted, this push has been lackluster so far. Further gains could increasingly open the door to a reversal. In such an outcome, keep a close eye on the 50-day SMA. The latter could hold as resistance, maintaining the downside focus. Key support is the 100% Fibonacci extension level at 127.98. Falling under it exposes the May 2022 low at 126.362.
--- Written by Daniel Dubrovsky, Strategist for DailyFX.com
To contact Daniel, use the comments section below or@ddubrovskyFXon Twitter


