


US Dollar, GBP/USD, USD/CAD, Technical Analysis, Retail Trader Positioning – IGCS Update
- US Dollar has been stabilizing in recent days after a string of losses
- Retail traders became more bullish GBP/USD, bearish USD/CAD
- Is this a sign that the US Dollar may strengthen in the coming days?

The US Dollar has been stabilizing in recent days after a string of losses earlier this month. In response, IG Client Sentiment (IGCS) has been showing that retail traders have been increasing upside exposure in GBP/USD while boosting downside bets in USD/CAD. IGCS tends to function as a contrarian indicator. With that in mind, is this a sign that the US Dollar might climb ahead?
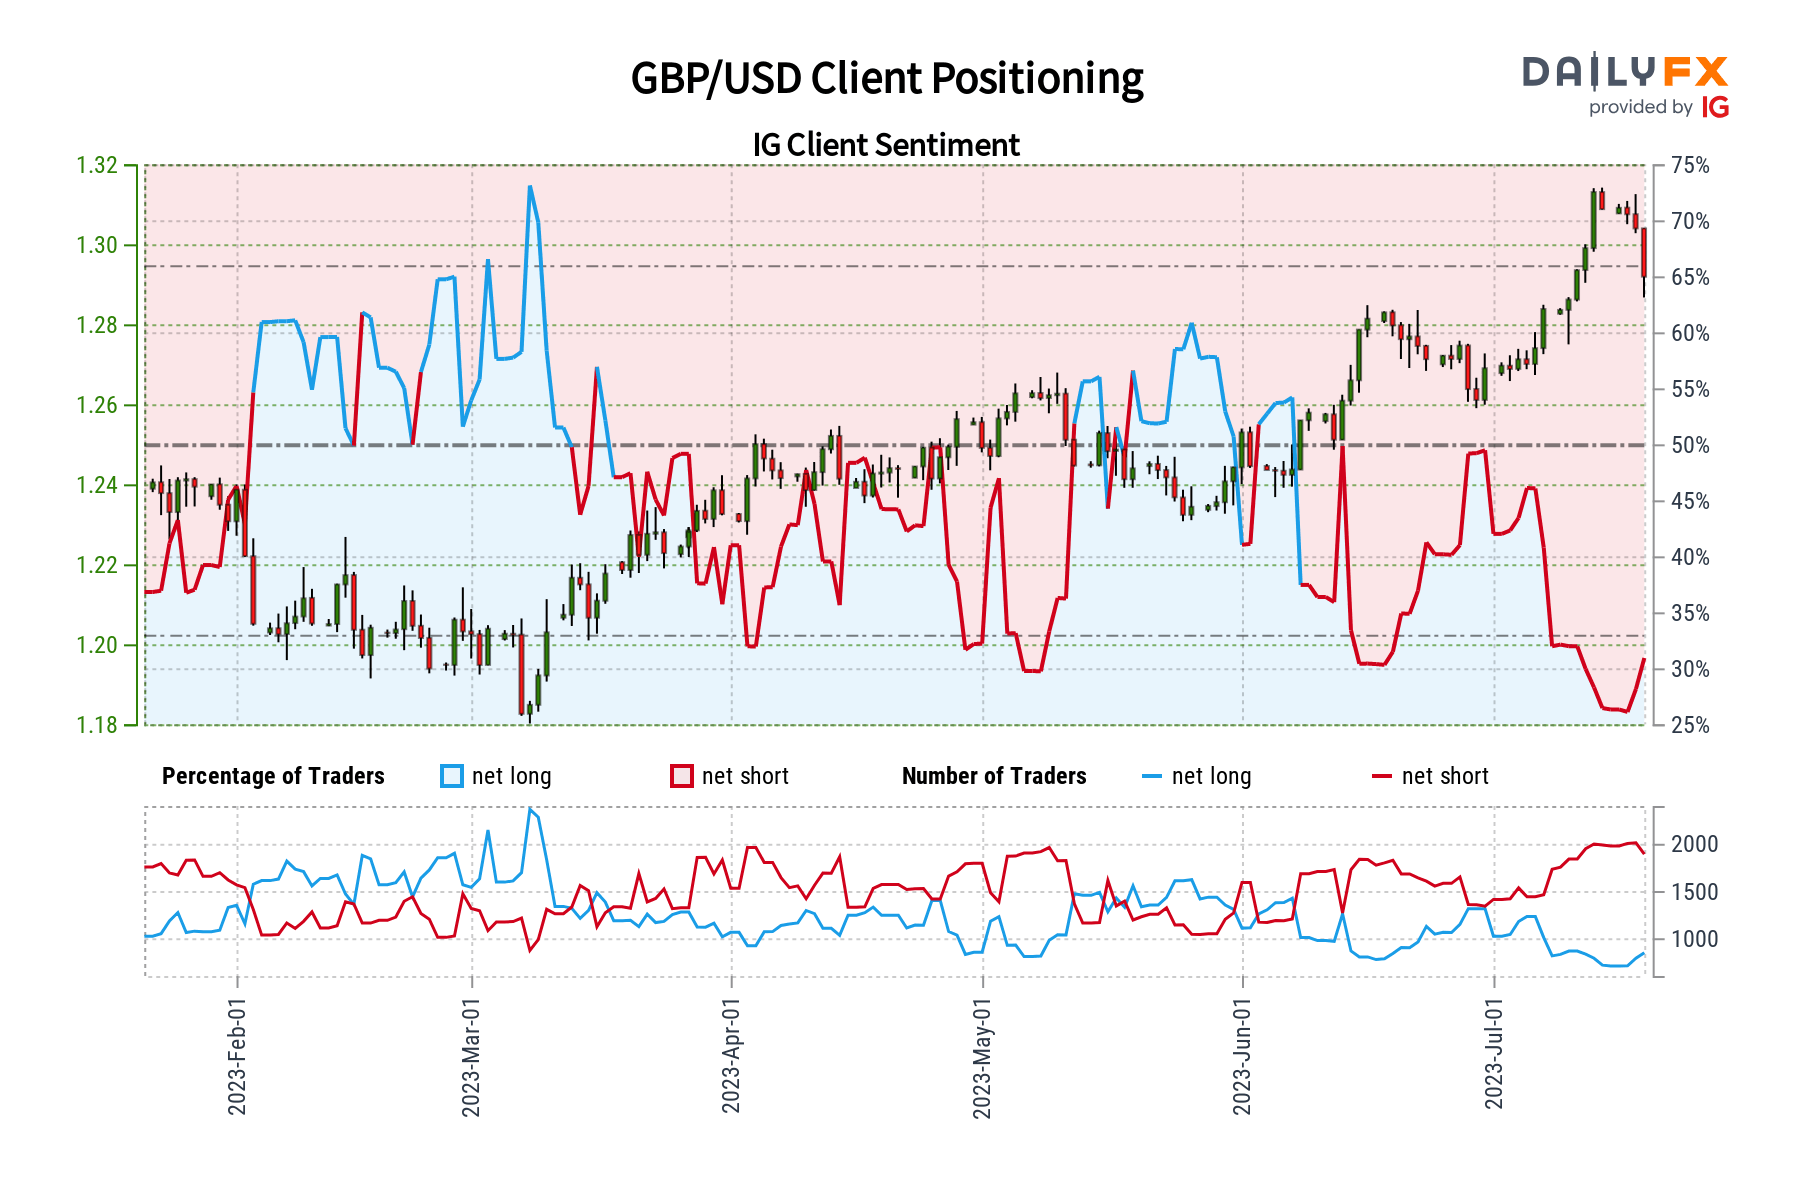
GBP/USD Sentiment Outlook - Bearish
The IGCS gauge shows that about 41% of retail traders are net-long GBP/USD. Since most traders are still biased to the downside, this hints prices may continue to rise down the road. That said, upside exposure has increased by 27.5% and 30.82% compared to yesterday and last week, respectively. With that in mind, recent changes in exposure hint that the price trend may reverse lower.
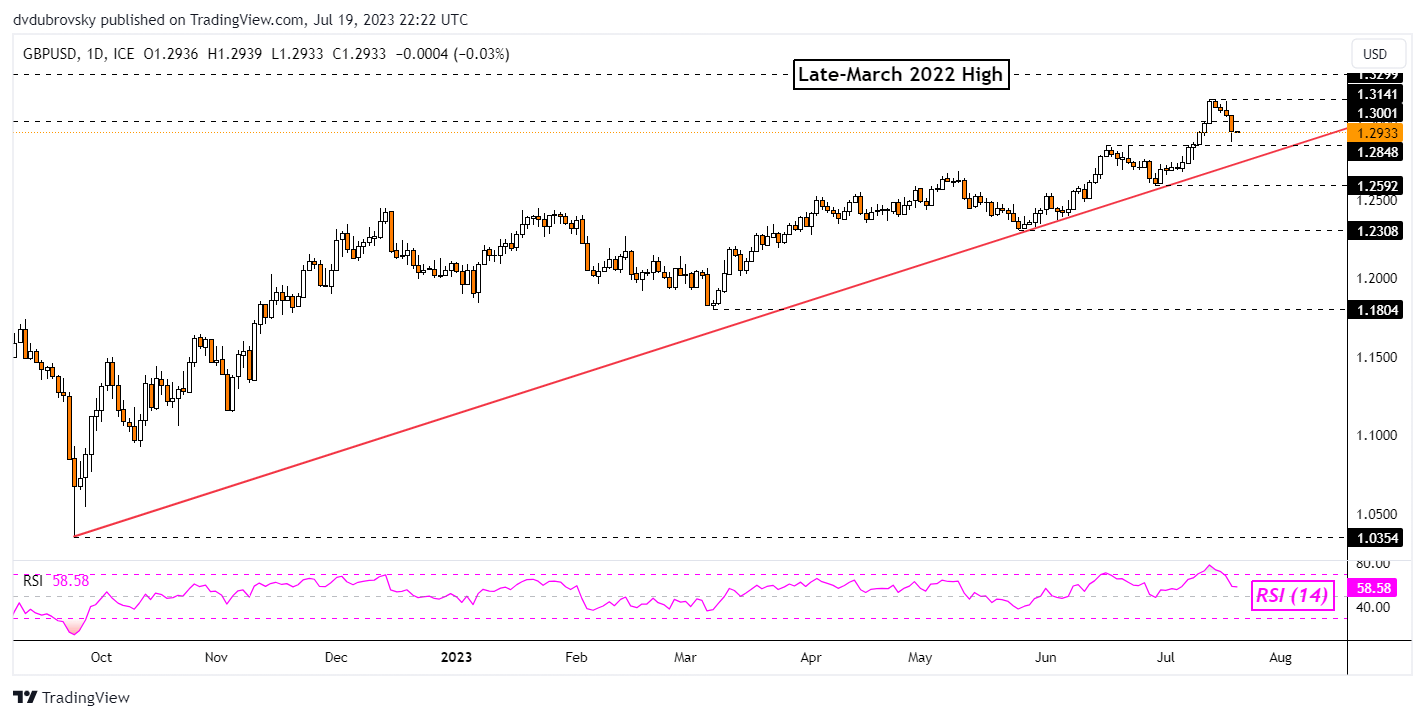
Daily Chart
On the daily chart, GBP/USD can be seen aiming lower in recent days after finding new resistance at 1.3141. Recent losses have brought Sterling closer towards the long-term rising trendline from the beginning of September. In the near-term, this could reinstate the broader upside focus. Otherwise, breaking lower would open the door to reversing the dominant uptrend.

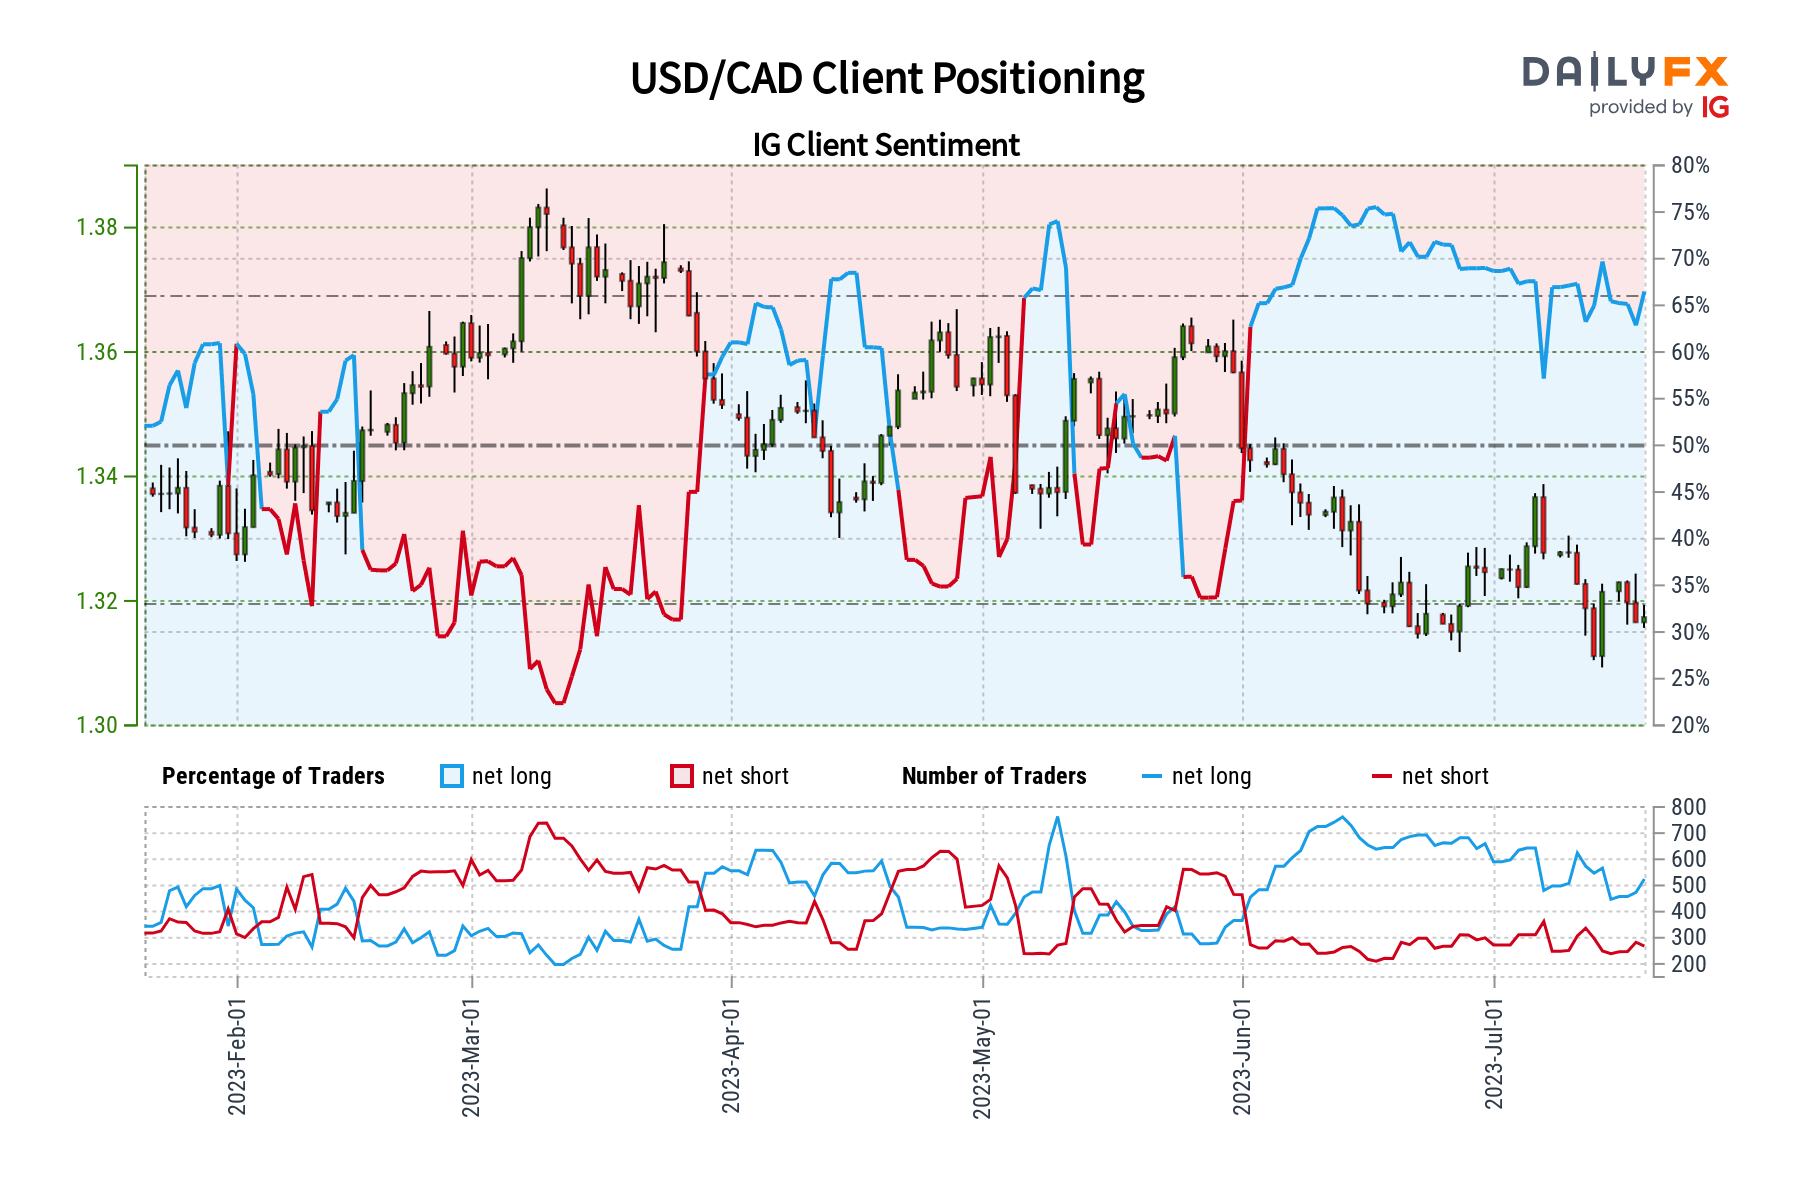
USD/CAD Sentiment Outlook - Bullish
The IGCS gauge reveals that about 65% of retail traders are net-long USD/CAD. Since most of them are still biased towards the upside, this hints that prices may continue to fall. However, downside exposure increased by 18.07% and 4.26% compared to yesterday and last week, respectively. With that in mind, recent changes in positioning hint that prices may soon reverse higher.
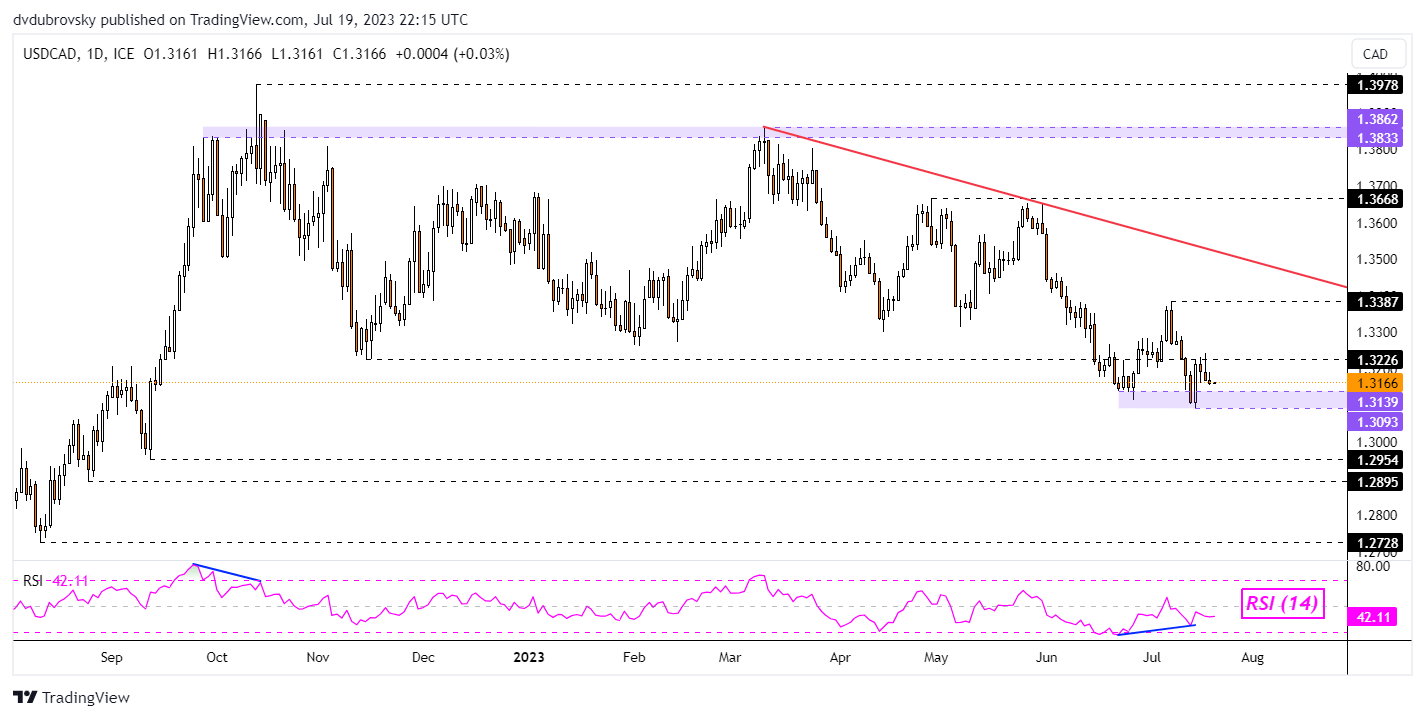
Daily Chart
On the daily chart, USD/CAD recently reinforced a support zone between 1.3093 and 1.3139. Prices are in a downtrend since March, guided by the falling trendline from that month (red line on the chart below). A turn higher places the focus on the July 7th high of 1.3387. Beyond that sits the falling trendline. Falling through support exposes the September low of 1.2954.
--- Written by Daniel Dubrovsky, Senior Strategist for DailyFX.com


