


Putting Forex Bearish Engulfings to the Test – Educational Report:
- Bearish Engulfings are commonly regarded as signals for downward price reversals
- This research study employs an automated detection strategy to test their effectiveness
- 37,000 candles were analyzed, identifying 200 valid BEs in EUR, GBP, JPY, AUD, CAD
- Using this, do Bearish Engulfings reliably function as reversal and/or topping signals?

A Bearish Engulfing (BE) is a candlestick pattern that can be identified when looking at virtually any financial trading instrument. All you need is an opening, high, low and closing price. As implied by the name, technicalists will often use these as signals that an upward-trending market might be readying to reverse. But as you might have heard past performance is not always indicative of future results.
This is not a report about the intricacies of Bearish Engulfings: which you may learn more about here. Rather, the purpose of this educational content is to test their effectiveness using price and price alone. This will come from the foreign exchange market (forex). At the end of the article, I will go over the key takeaways and some of the limitations of this study. In the meantime, let us set some ground rules.
Identifying Bearish Engulfings – EUR/USD, GBP/USD, USD/JPY, AUD/USD, USD/CAD
Almost 37,000 candles were analyzed between EUR/USD, GBP/USD, USD/JPY, AUD/USD and USD/CAD using daily data since 1995 from TradingView. One of the reasons why I chose the foreign exchange market is because of its unparalleled liquidity, especially amongst the major pairs. This helps produce smoother price action compared to other markets, such as stocks and cryptocurrencies.
How did I identify Bearish Engulfings? It was based on a set of rules I coded to search over each candle to recognize if it was valid. For this study, I focused on a near-term horizon, which translates to 20 days before and after an engulfing. In total, there are too many rules to go over. Instead, let us look at some of the most important ones:
Bearish Engulfing Detection Rules
- The Bearish Engulfing body must meet a minimum size requirement, it cannot be too small
- The body of the candle before the BE (the pre-candle) cannot be too small relative to the BE body
- Rather than the pre-candle low, the BE must close under the pre-candle open
- Before the BE, there must be the appearance of an uptrend (no downtrends or flat price action)
- The pre-candle close must also be a 20-day high close, with some cautious room for error
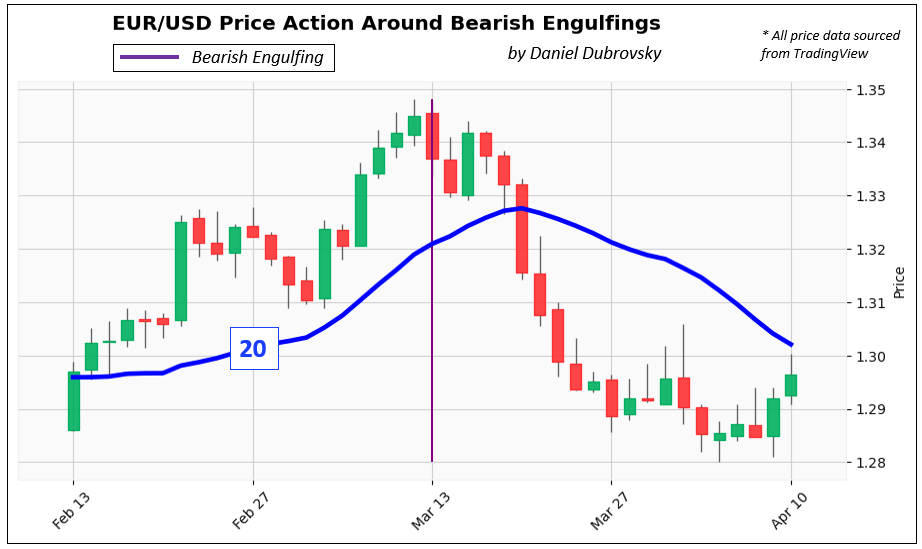
Limitations to these rules and subjectivity will be discussed at the end of this report. In the meantime, the chart below is an example of a detected EUR/USD Bearish Engulfing pulled on March 13th, 2005. This serves as an example of a clean one. Notice how the price was trending higher before the BE and the pre-candle close was a 20-day high close. After the BE, the price turned lower as one would expect.
In total, the code detected slightly over 200 Bearish Engulfings from a possible almost 37,000 candles. Of course, not all of them were as clean as the one below. If you would like to watch how some of the other cases appeared, I highly encourage you to check out this link to a Twitter thread I made that displays some of the Bearish Engulfings in each pair.

37,000 Candles, Over 200 Bearish Engulfings, How Do the Trends Look Like?
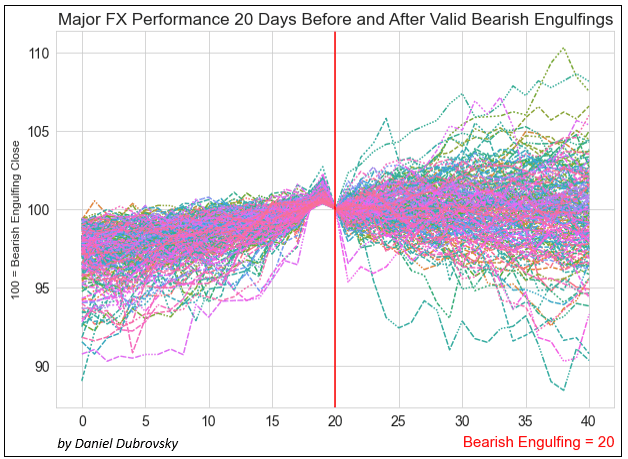
Below is a chart that plots each Bearish Engulfing trend 20 days before and after its appearance. To make sure that every trend was in the same scale range, each BE (close) was indexed to 100 as a starting point.
In the period leading into the BE, you can see how the trends were rising with a consistent pattern and range. Then, the day before the BE was always the peak. This is what creates the dip into the BE, which represents the close under the pre-candle.
What happens after the Bearish Engulfing? The trends continue for 20 days and with each passing period, spread out in a cone or triangle-like fashion. The right side also exhibits a larger dispersion of prices (variance) than the left, with a wide range of peaks and troughs. At first glance, this speaks to randomness and pours cold water on the idea of Bearish Engulfings as consistent reversal signals. But we need to take a closer look.
How Does the Average Bearish Engulfing Trend Look Like?
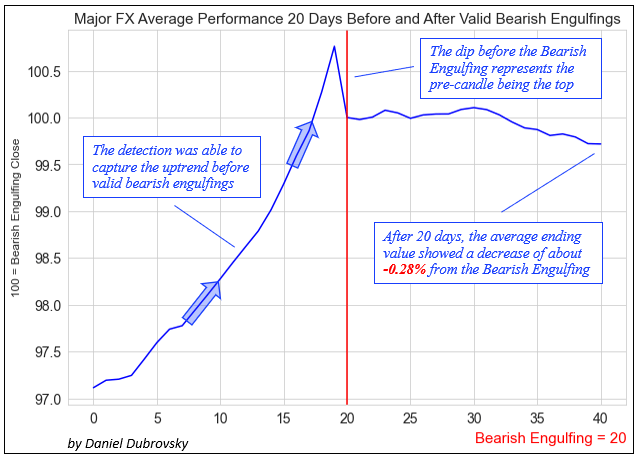
That is where the next chart comes in, which is the average Bearish Engulfing trend. This visualization confirms that the code was able to consistently capture the uptrend before the BE. Just like with the previous chart, you can see the top right before the BE before the price fell to 100, representing the dip into the engulfing. After the engulfing, prices continued lower, finishing -0.28% on average 20 days after the BE. So, it appears that there is a slight downward bias in the post-BE trend. I would argue that this is not the most important takeaway from this analysis.
Bearish Engulfings: Reversal or Topping Signal?
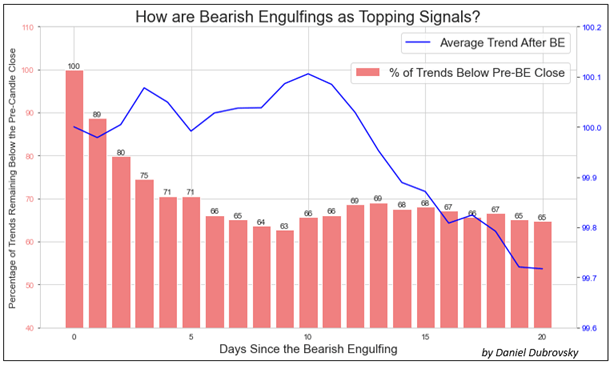
The last chart overlays the average Bearish Engulfing series, with the percentage of trends that closed below the pre-candle for each day. For example: after 5 days, 71% of trends remained below the pre-candle close. After 10 days, this number shrank to 66%, then rose to 68% on the 15th day and finally ending at 65% on the 20th day. In other words, on average, about two-thirds (2/3) of trends remained below the top after one month.
Here is a fun fact: after 20 days, the ending price observations created a statistically significant normal distribution. This means we can alternatively use a Cumulative Distribution Function (CDF) to calculate the probability of a series in this sample finishing below the top. And just like with the results mentioned earlier, that clocks in at roughly 65% as well.

What’s the Verdict on Bearish Engulfings?
After analyzing almost 37,000 candles between EUR/USD, GBP/USD, USD/JPY, AUD/USD and USD/CAD, identifying at least 200 Bearish Engulfings, it seems that this candlestick pattern functions better as a topping signal than a reversal one. While the average trend finished almost -0.3% after 20 days, 2/3 of them remained below the top. In other words, if we can identify valid Bearish Engulfings in this market, it might be worth paying attention to. But, let us go over some study limitations.
Study Limitations
While Bearish Engulfings can be observed universally between markets, understand that a specific subset of the forex market was analyzed for this study, and it might be the most relevant to the pairs studied. Furthermore, this is based on a sample of a little over 200 Bearish Engulfings. More might be needed to enhance the validity of this study, (or even disprove it).
As much as I tried to keep this study as objective as possible, there is some inherent subjectiveness in technical analysis. For example, while most people can universally agree on the dimensions of a Bearish Engulfing and how they appear, the background in which they form is more fluid. In this sample, I considered if the BE closed under the pre-candle open and not the pre-candle low. Some may debate that the latter is more proper.
Another important factor is the timeframe. This was conducted on daily data, but you could theoretically analyze different layers of time horizons. That also includes the duration you measure before and after the engulfing. This study was focused on near-term price action, but you could also analyze broader trends, such as 40 days before and after the Bearish Engulfing.
If you would like to learn more about Bearish Engulfings, check out the comprehensive guide here.
Trade Smarter - Sign up for the DailyFX Newsletter
Receive timely and compelling market commentary from the DailyFX team
--- Written by Daniel Dubrovsky, Senior Strategist for DailyFX.com


