


Swiss Franc, EUR/CHF, Euro, USD/CHF, US Dollar - Talking Points
- EUR/CHF has seen a decent move but remains in formation
- USD/CHF has fallen back into the range with lower volatility
- If momentum picks up, will a new trend emerge in EUR/CHF?

EUR/CHF TECHNICAL ANALYSIS
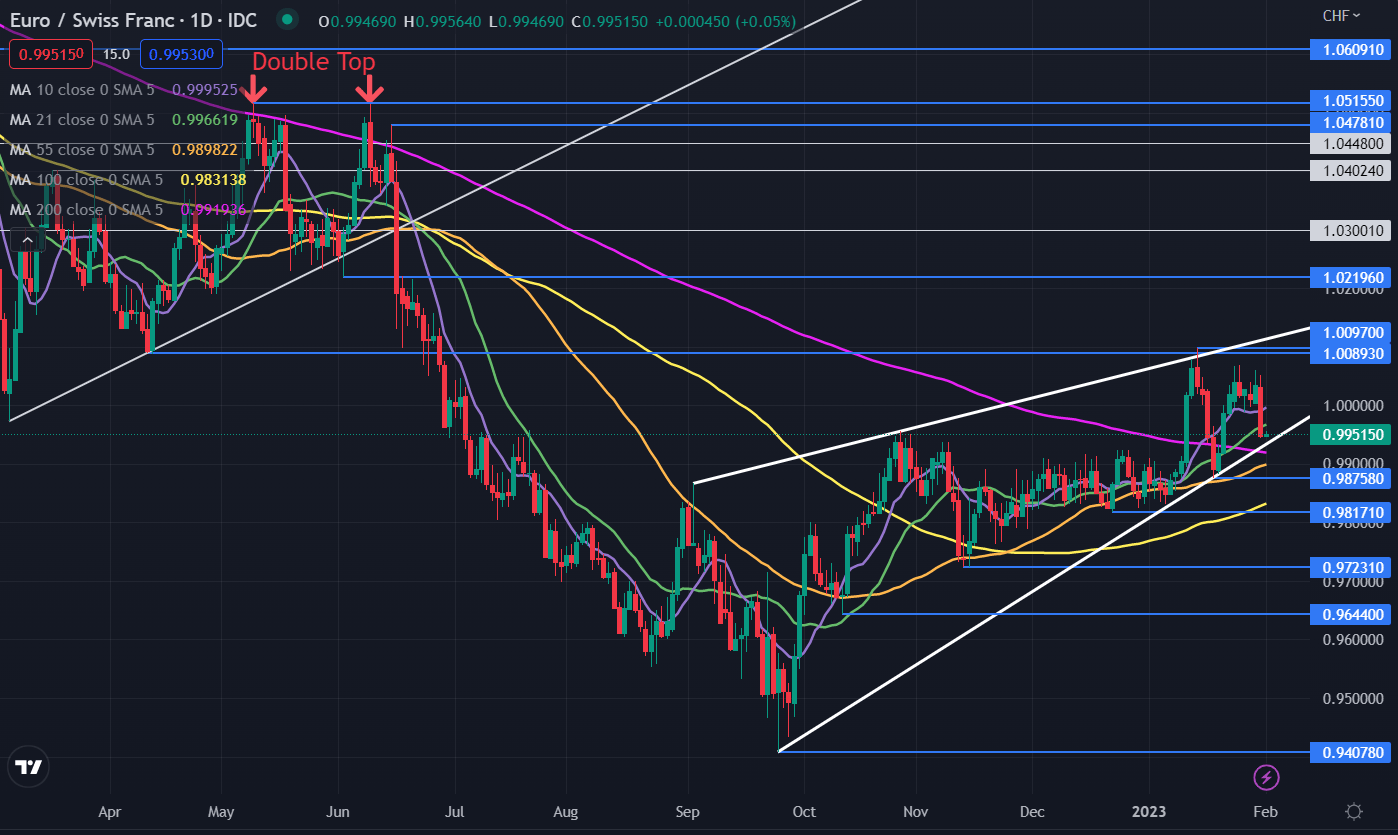
The Swiss Franc saw its largest gain against the Euro since early November on Wednesday after failing to overcome breakpoint resistance last month.
EUR/CHF made a high of 1.0097 in January which was just above a breakpoint resistance level at 1.0089. These levels may continue to offer resistance.
That move also briefly went above an ascending trend line but was unable to sustain the rally. This might signal a false break which could indicate a longer-term reversal.
After making an all-time low at 0.9407, the price action has created a rising wedge formation, also known as an ascending wedge. This can be observed by noting ascending trend lines above and below the price that are converging.
A break below the lower trend line may signal that bearish momentum might unfold.
Prior to EUR/CHF breaking lower yesterday, it was above all short, medium and long-term Simple Moving Averages (SMA).
The move lower beached below the 10- and 21-day SMAs which could signal that short-term bullish momentum has faded.
If EUR/CHF breaks out of the rising wedge on the downside and continues down through the 55-, 100- and 200-day SMAs, this could signal that bearish momentum is evolving.
Support may lie at the previous lows of 0.9876, 0.9817, 0.9723, 0.9644 and 0.9407.

USD/CHF TECHNICAL ANALYSIS
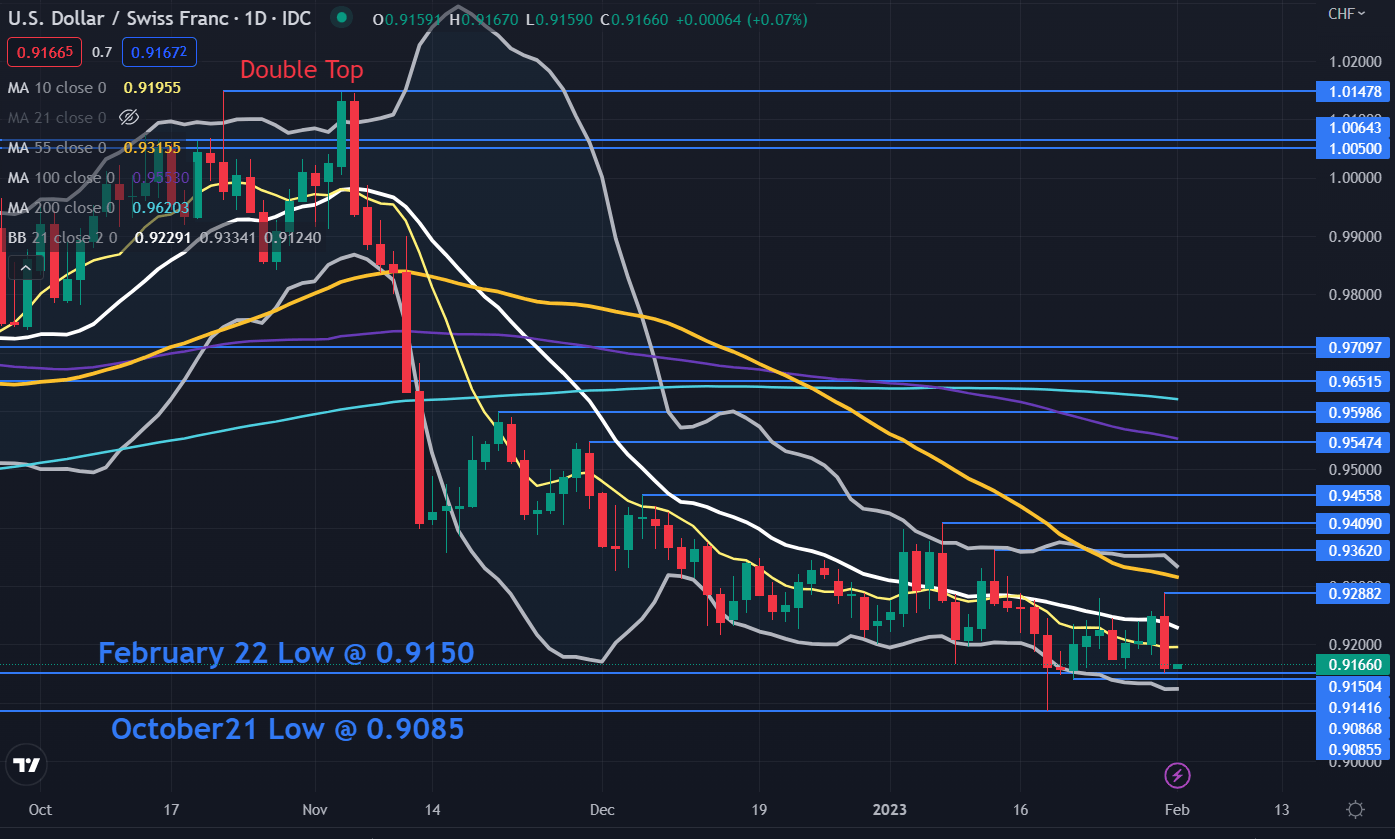
USD/CHF collapsed on Wednesday but paused at the breakpoint support level that was created from the February 2022 low of 0.9150.
It may continue to provide support ahead of the October 2022 low of 0.9087 that was tested and held last month.
USD/CHF has been in a 0.9085 – 0.9409 range for two months with volatility decreasing, as illustrated by the narrowing of the 21-day Simple Moving Average (SMA) based Bollinger Bands.
On the topside, resistance might be offered at the previous highs of 0.9288, 0.9362, 0.9409, 0.9456, 0.9547 and 0.9591.
Although USD/CHF has been range-bound, it is once again below all short, medium and long-term SMAs. It has been in this state several times recently without gaining directional momentum. A breakout of the range might see momentum unfold in that direction.
--- Written by Daniel McCarthy, Strategist for DailyFX.com
To contact Daniel, use the comments section below or @DanMcCathyFX on Twitter


