S&P 500, Nasdaq 100, Nikkei 225 Analysis and Charts
S&P 500 hits new high
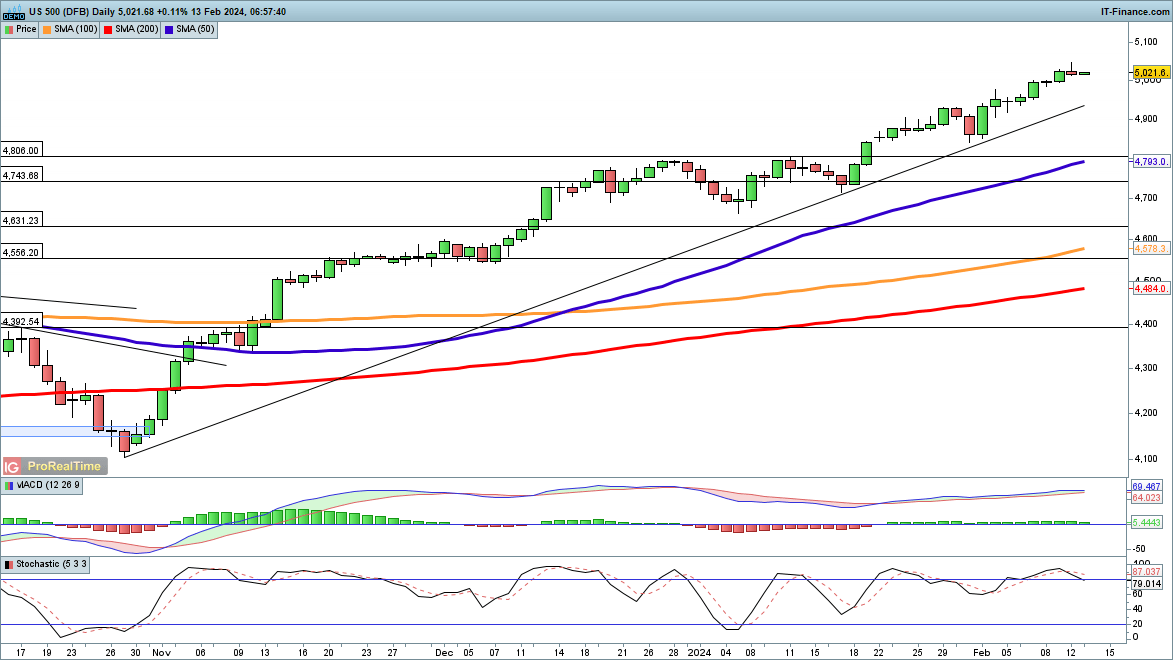
The steady rally in this index goes on, and having moved above 5,000 last week the index made a fresh high on Monday.There is little sign of any major pullback at present, with the most recent weakness in late January meeting trendline support from the October low.
In the event of a more substantial pullback, the previous highs from early January at 4806 come into view, along with the 50-day simple moving average (SMA).
S&P 500 Daily Chart
Retail trader data shows 28.08% of traders are net-long with the ratio of traders short to long at 2.56 to 1. The number of traders net-long is 5.35% higher than yesterday and 4.19% lower than last week, while the number of traders net-short is 2.10% lower than yesterday and 9.92% higher than last week.
See what this means for S&P 500 price action
| Change in | Longs | Shorts | OI |
| Daily | 1% | -1% | 0% |
| Weekly | -16% | 11% | -3% |
Nasdaq 100 breaks 18,000
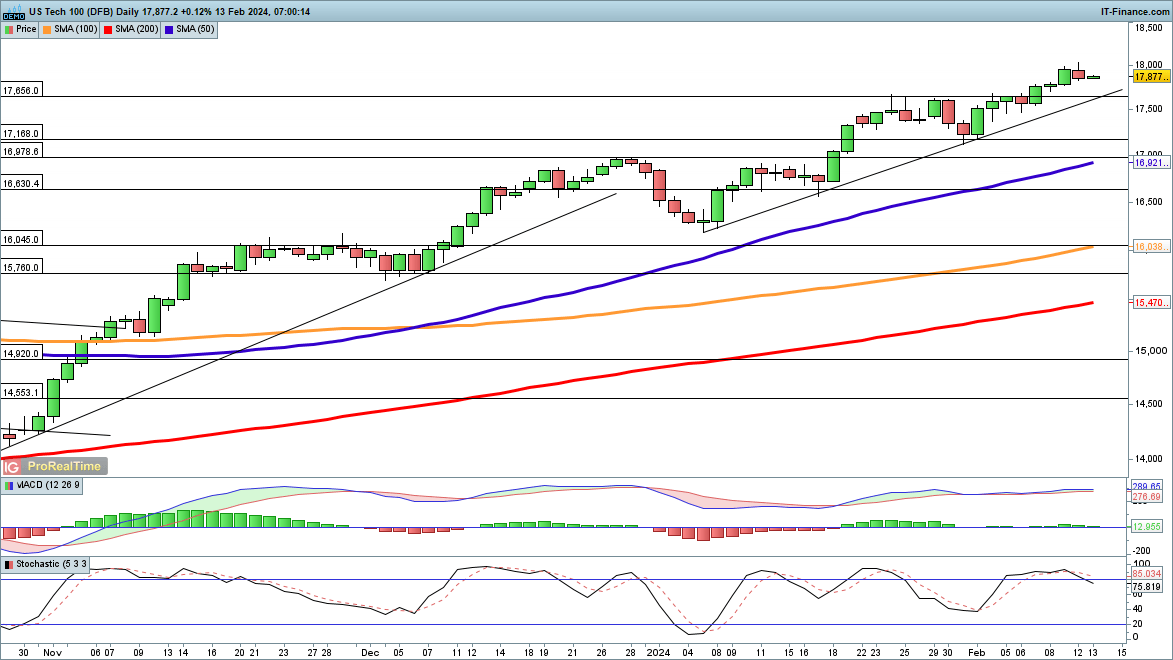
This index succeeded in breaking 18,000 yesterday, hitting yet another new high.Short-term trendline support from early January continues to hold, while the previous high at 17,656 also remains intact, maintaining a bullish view in the short term.
Nasdaq 100 Daily Chart

Nikkei 225 continues to soar
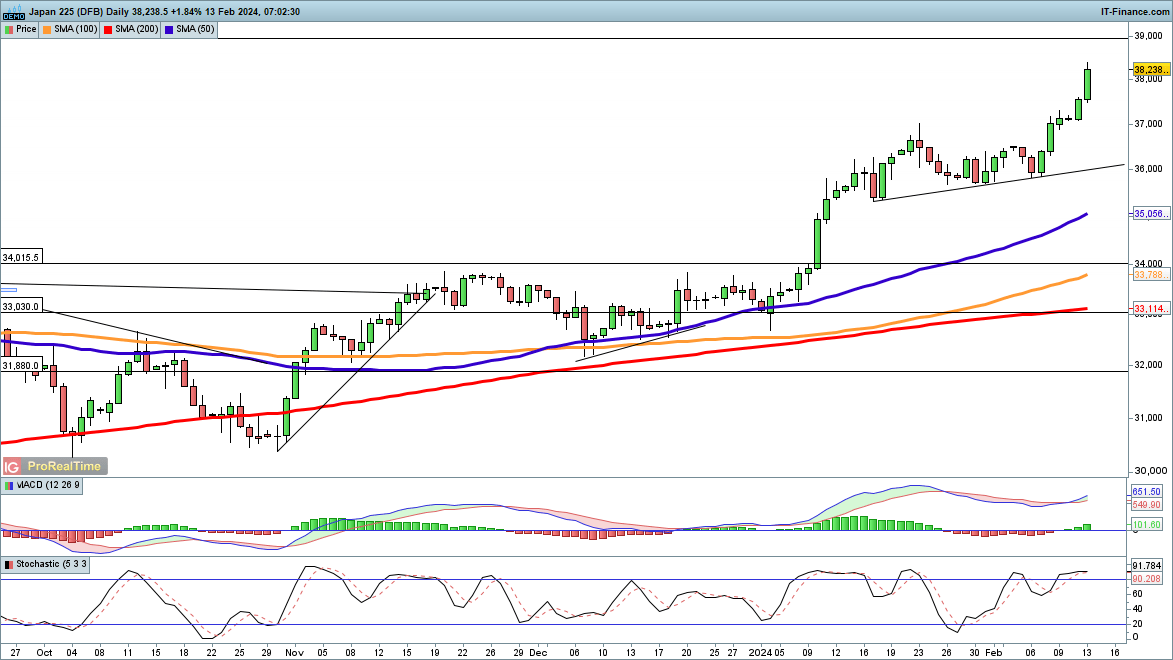
The Nikkei 225’s astonishing run in 2024 continues, with the index making fresh strides towards its previous record high. The index has climbed through 36,000, 37,000, and 38,000 in the space of a month, with breakaway momentum carrying to its highest level since 1990.
In the short-term, it may be overextended, and given the size of the move higher over the past week even a drop towards trendline support from mid-January, a fall of around 2000 points, would feel quite dramatic.
Nikkei 225 Daily Chart