
S&P 500, Nasdaq 100, Nikkei 225 Analysis, and Charts
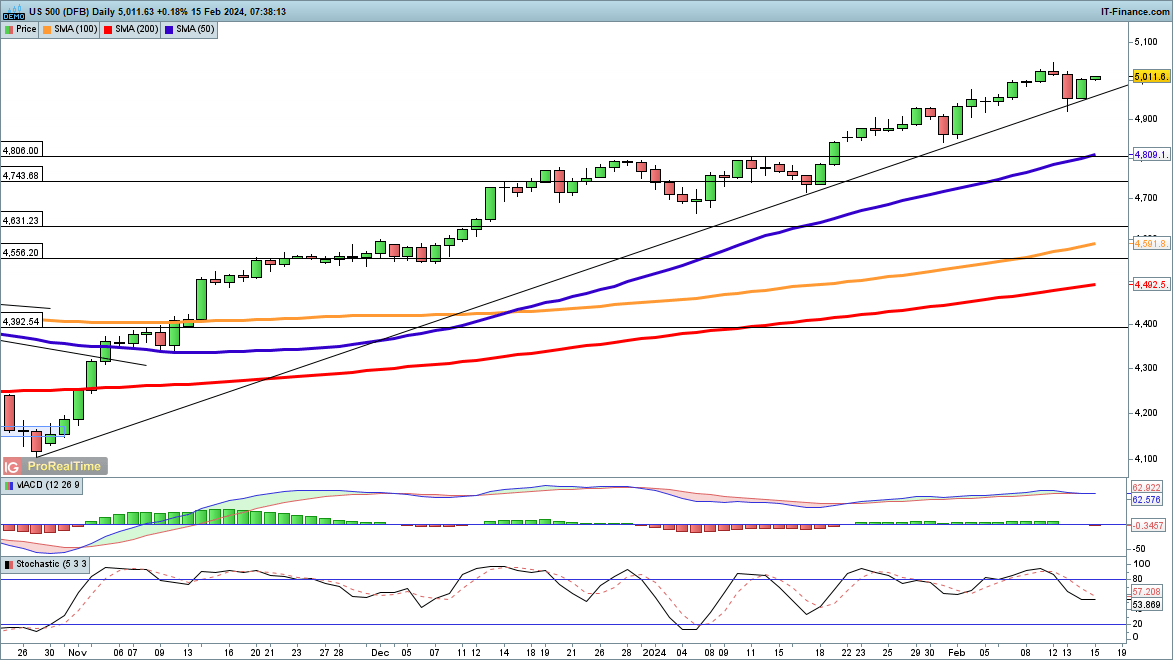
S&P 500 back above 5000
Wednesday saw the index recover from Tuesday’s losses, holding uptrend support from late October.It has pushed above 5000 in early trading, and looks set to move towards fresh record highs above the previous high of 5049.
A close below trendline support could mark a more bearish development, opening the way in the short-term toward the 50-day simple moving average.
S&P500 Daily Chart
See how changes in daily and weekly sentiment can affect price action:
| Change in | Longs | Shorts | OI |
| Daily | 1% | -1% | 0% |
| Weekly | -17% | 11% | -3% |
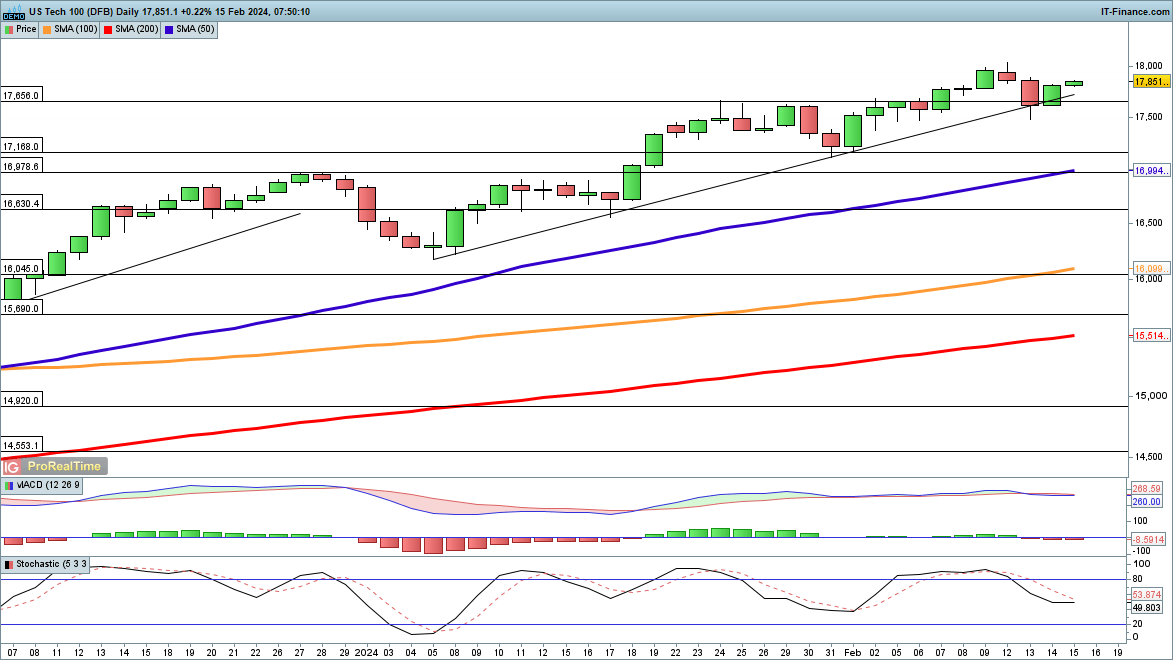
Nasdaq 100 resumes its march higher
This index has also held trendline support from early January, with Tuesday’s selloff failing to turn into anything more substantial.A push to new record highs would also be a plausible outcome here, with the highs at 18,043 from Monday forming the only area of potential resistance.
A close below 17,500 would be needed to indicate that some near-term weakness is at hand.
Nasdaq100 Daily Chart
Download our free Q1 equities forecast:

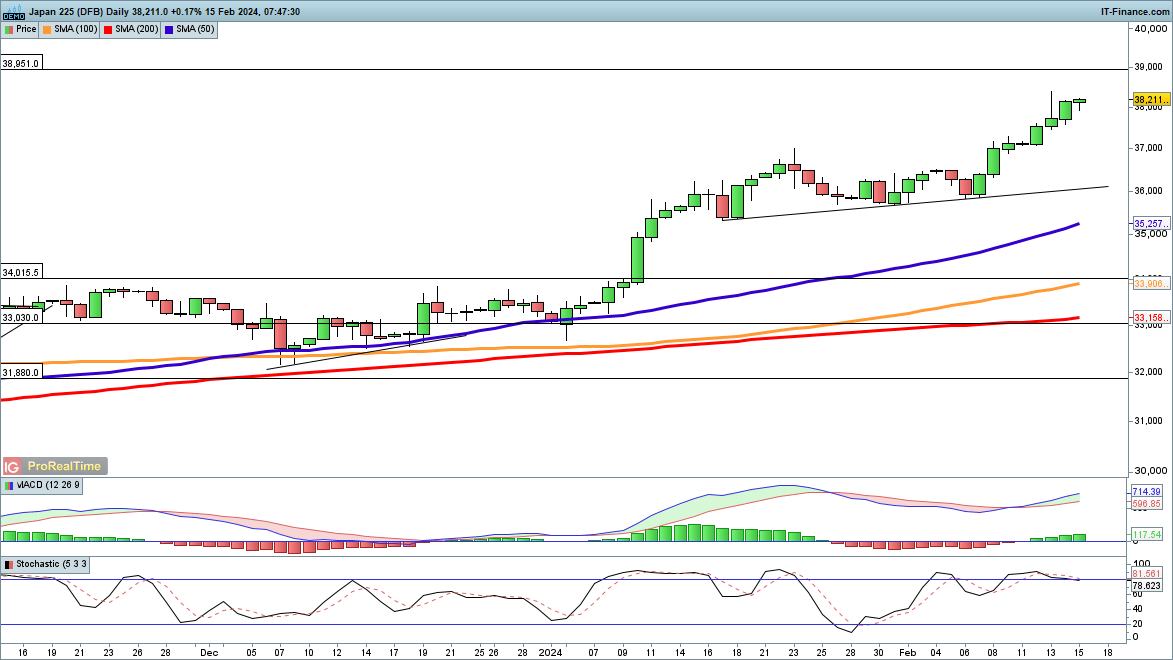
Nikkei 225 rallies again
News that Japan fell into recession in Q4 has not dented this index.The Nikkei shrugged off the US inflation data on Tuesday and continued to move higher. It now looks likely it will test Tuesday’s high at 38,406. Beyond this likes the record high at 38,951.
In the short-term, a pullback may target trendline support from early January, taking the index down towards 36,000.
Nikkei 225 Daily Chart