


Technical Analysis: USD/JPY, EUR/JPY, GBP/JPY
- USD/JPY heeds bearish signal identified at the start of the week
- EUR/JPY approaches key pivot point
- GBP/USD ‘double tope’ limits upside potential
- The analysis in this article makes use of chart patterns and key support and resistance levels. For more information visit our comprehensive education library

Japanese Yen Adds to Bullish Lift
The Japanese yen appears to be building on some early upward momentum, in the aftermath of a moderately hawkish Bank of Japan meeting in January. While there was no change to negative interest rate or alterations to the ongoing yield curve control, BoJ Governor Kazuo Ueda sees the likelihood of reaching the 2% target as “gradually increasing”. A simple, constructed Japanese yen index below shows a steady rise in the value of the yen yesterday and today thus far.
Constructed Japanese Yen Index- Equal Weighted Average of USD/JPY, GBP/JPY, EUR/JPY, AUD/JPY
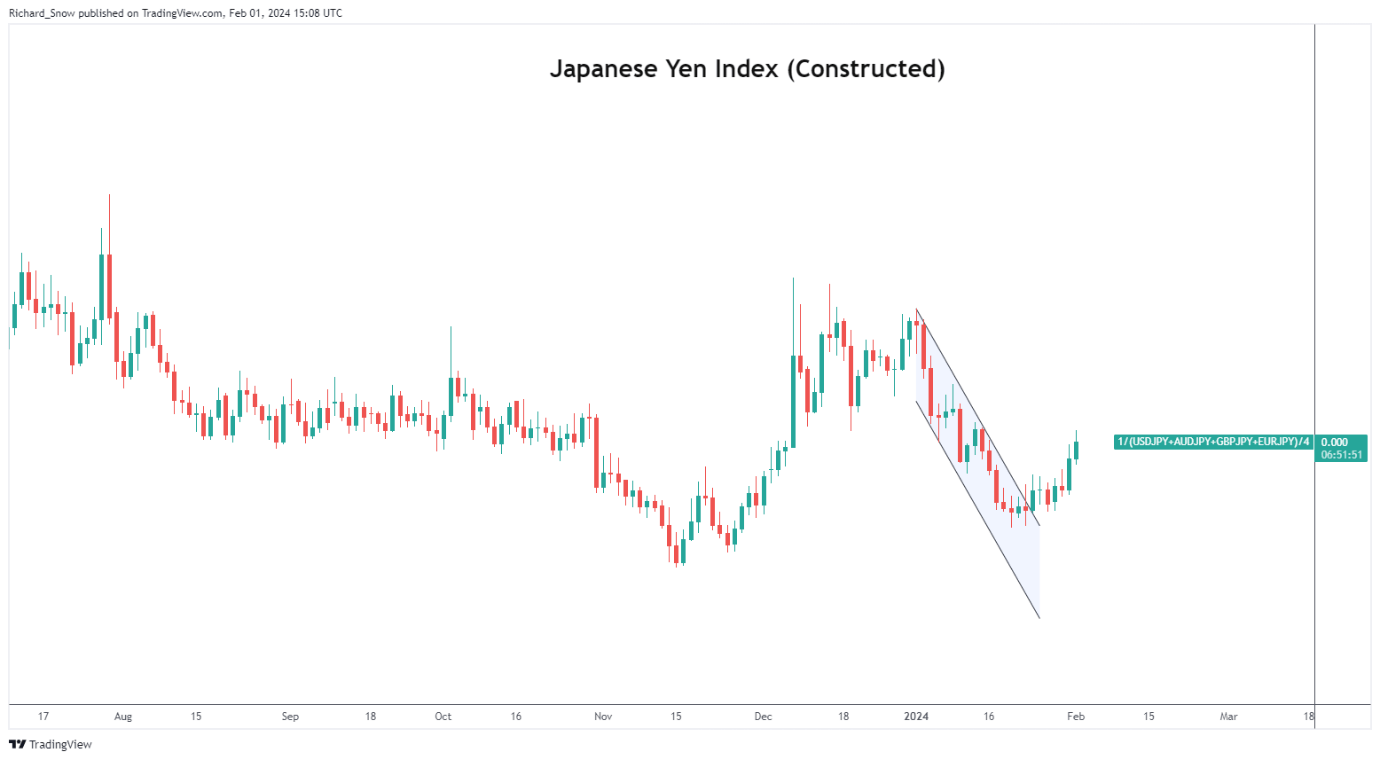
Source: TradingView, prepared by Richard Snow
The weekly hanging man candle was identified in the weekly US dollar forecast and it signalled a possible move lower in USD/JPY ahead of this week. Since then, the subsequent red candle (this week thus far) heads lower, testing the 146.56 mark.
USD/JPY Weekly Chart
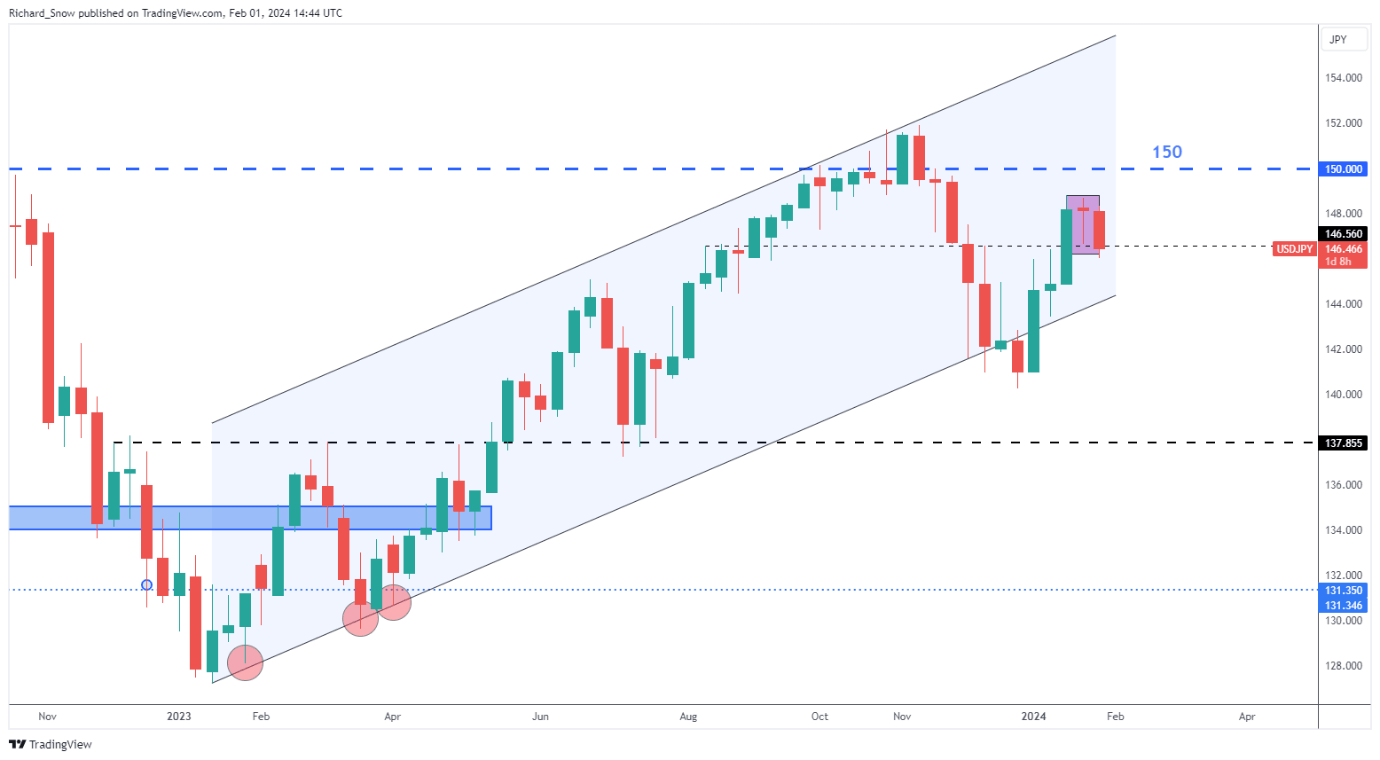
Source: TradingView, prepared by Richard Snow
The daily chart shows the invalidation of a developing bullish pennant as price action heads lower. This presented an example where the longer timeframe view clashed with shorter-term, daily developments -highlighting the importance of multi-timeframe analysis and recognition of the longer-term dynamics.
The pair currently tests the 146.50 level with 145 not far away. It is then that the 200-day simple moving average appears at long-term channel support. The zone of support may be difficult to breach should price action drop enough to test the area.
USD/JPY Daily Chart
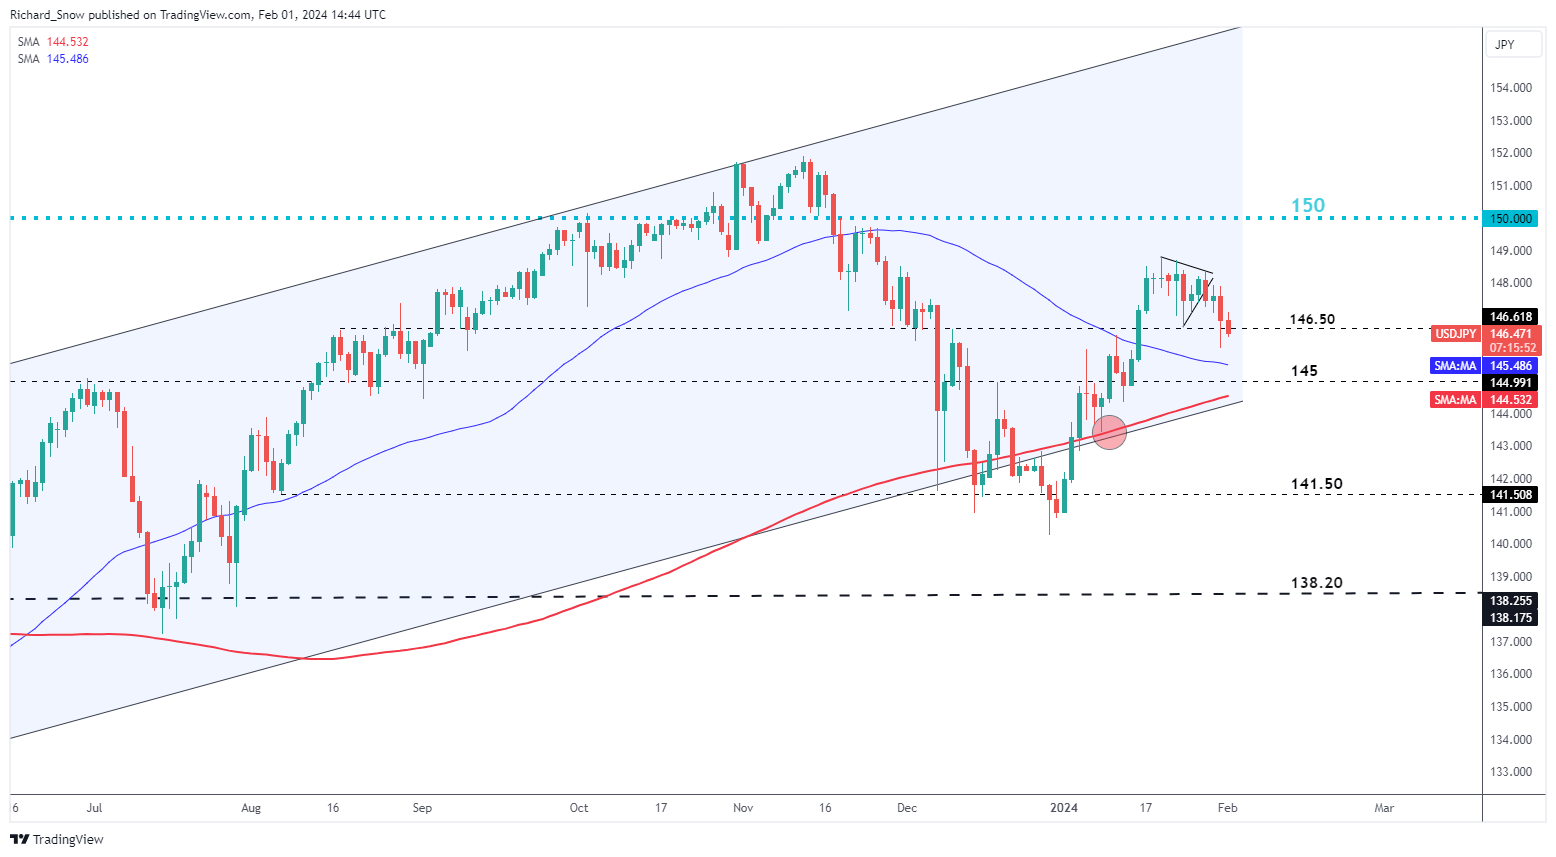
Source: TradingView, prepared by Richard Snow

EUR/JPY Approaches Key Pivot Point
EUR/JPY signalled a slowdown in bullish momentum (evidenced by longer upper wicks) before stalling and heading lower. The pair now tests the 50-day simple moving average but more importantly, heads towards a key pivot point in 157.94. The level has come into play as resistance in June, July and December of last year and provided a zone of resistance throughout September (on a closing basis).
The recent selloff has been characterised by two bearish engulfing candles, helping to spur on sellers. The 200 SMA is the next level of support at 156.64 if the pair has enough momentum to breach 157.94. In the event Support process too much to handle once again, 159.76.
EUR/JPY Daily Chart
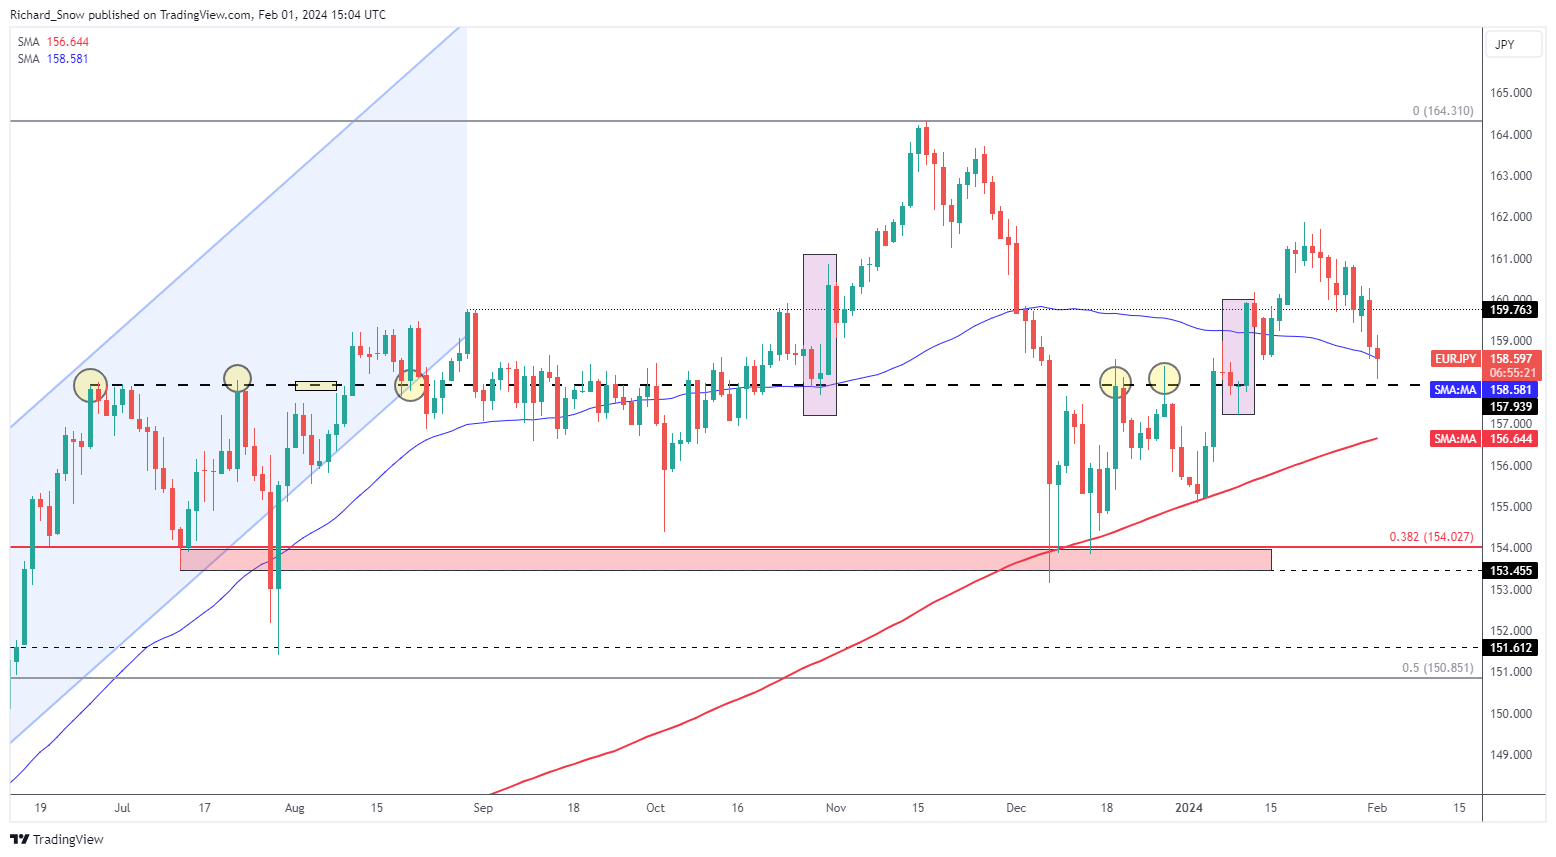
Source: TradingView, prepared by Richard Snow
GBP/JPY ‘Double Top’ Limits Further Upside Potential
On the weekly GBP/USD chart, a notable double top appears to be limiting a bullish continuation over the long-term. 188.80 has proven to be too tough to crack with prices easing before potentially attempting another go.
GBP/USD Weekly Chart
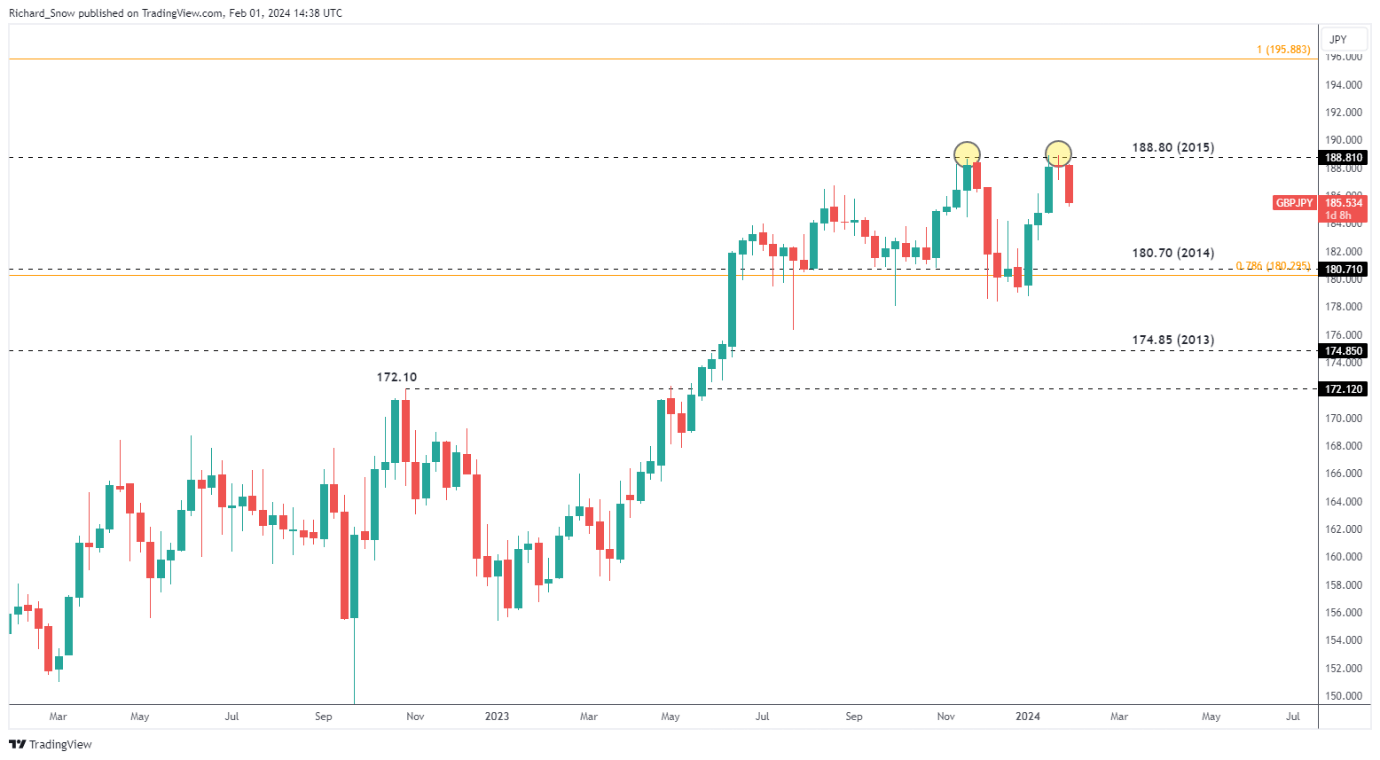
Source: TradingView, prepared by Richard Snow

GBP/USD exhibited very little movement considering we heard from the Bank of England provide its monetary policy update alongside the release of its updated forecasts. 188.80 appears a long way away now that the pair had headed lower in recent sessions.
184.00 flat is the next level of support to keep in mind as it also coincides with the 50-day simple moving average. The MACD supports the continuation of bearish momentum after exhibiting a bearish crossover and the RSI currently sits in the neutral zone – suggesting that any attempt to arrest this decline would have to be substantial.
GBP/USD Daily Chart
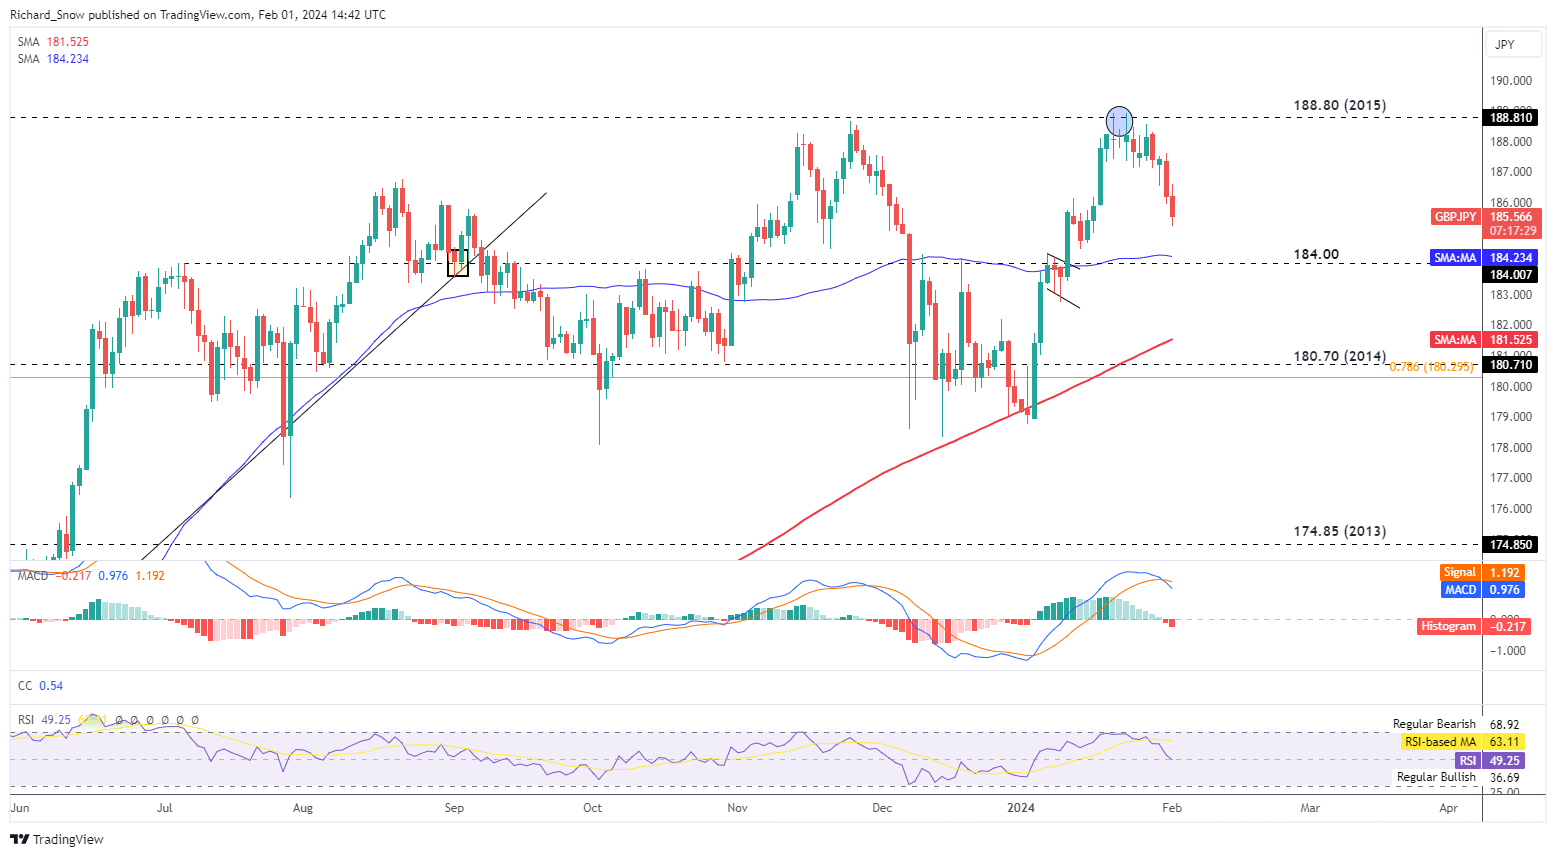
Source: TradingView, prepared by Richard Snow
--- Written by Richard Snow for DailyFX.com
Contact and follow Richard on Twitter: @RichardSnowFX


