


Japanese Yen, USD/JPY, US Dollar, Ichimoku Kinko Hyo, Bollinger, Momentum - Talking Points
- USD/JPY has steadied at the open of the week as markets recalibrate
- The leading components of the Ichimoku Cloud might be pivotal for direction
- If the trend remains in play, how low will USD/JPY go?

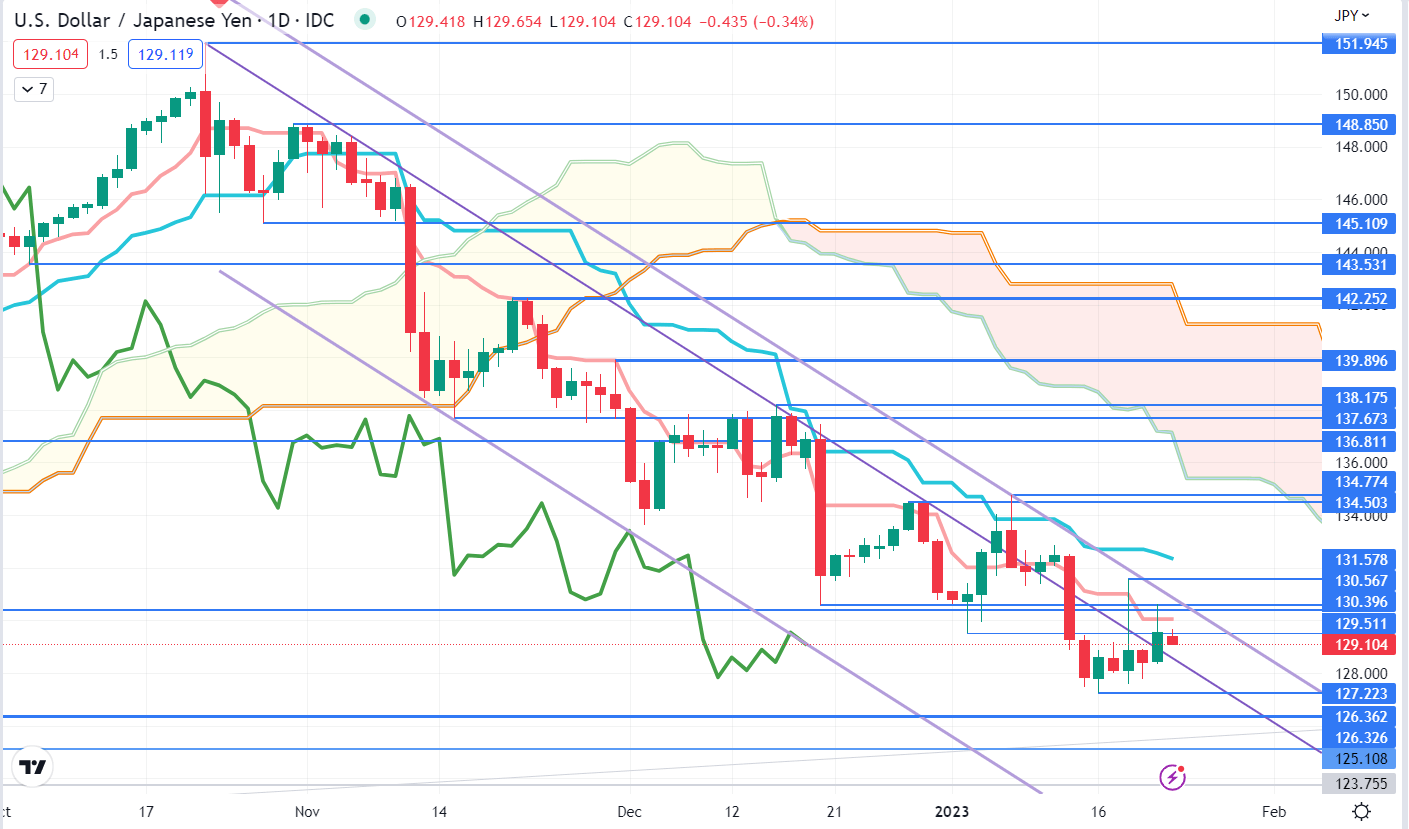
USD/JPY ICHIMOKU CLOUD
The Japanese Yen depreciated against the US Dollar going into the end of last week, but USD/JPY remains in a descending trend channel.
In late November the price moved below the Ichimoku Kinko Hyo, which is often referred to as the Ichimoku Cloud, and confirmed the end of the preceding bullish run.
That initial move also went below the Senkou Span A (Leading Span A) and the Senkou Span B (Leading Span B) to indicate that bearish momentum could unfold, which did happen in this instance.
It should be noted though that past performance is not indicative of future results.
The price tried to move back above both of the Senkou Spans but has been unable to close above both of them. This could suggest that the bearish momentum remains intact for now.
If a daily close occurs above both of these Senkou Span, it may indicate a pause in bearish momentum or, a potential reversal.
Nearby resistance could be at the breakpoints of 130.40 and 130.57 which currently coincide with a descending trend line. Further up, resistance might be at the prior peaks of 131.58 and 134.77.
On the downside, support might lie at the April and May lows from last year at 125.11, 126.33 and 126.36. Last Monday’s low of 127.22 could provide close-by support.

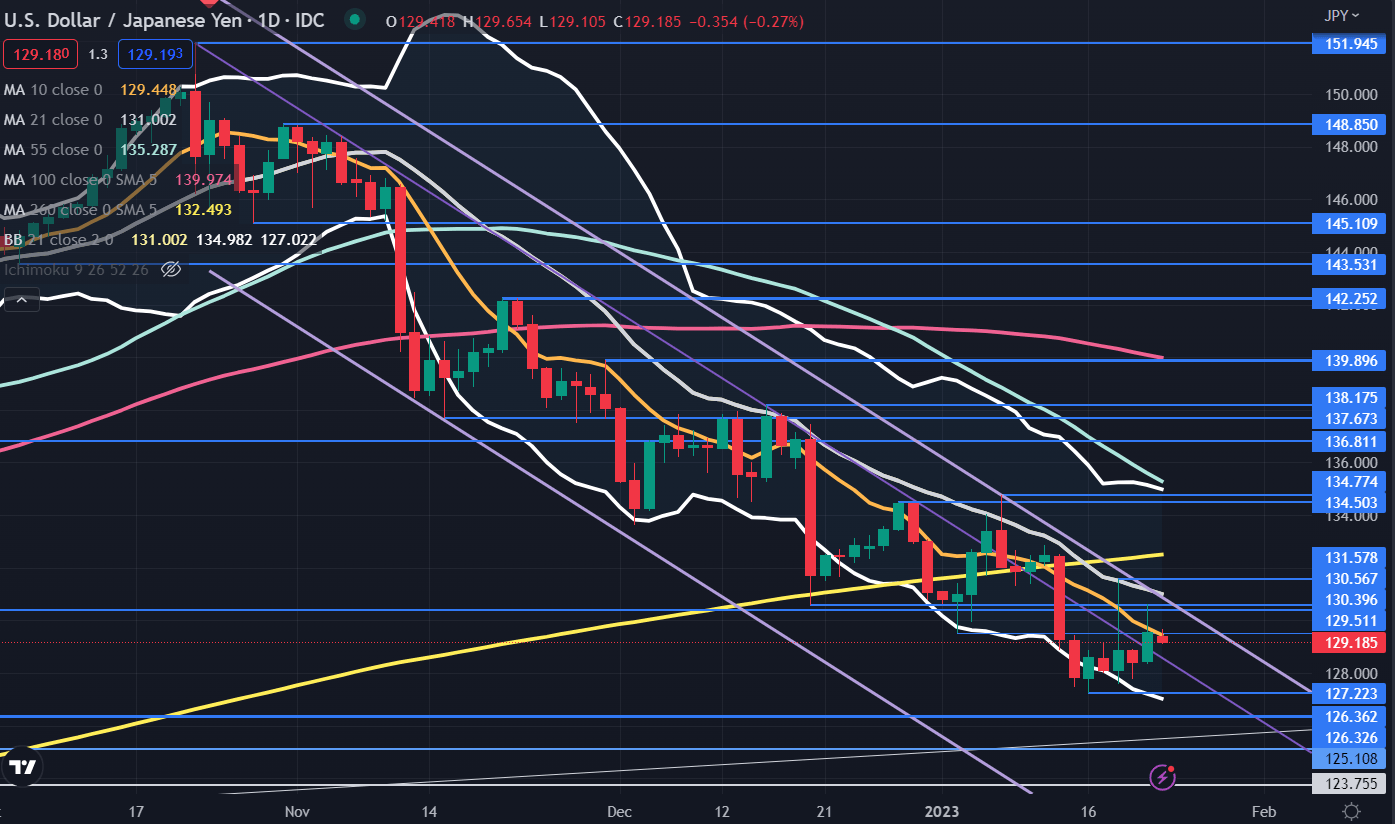
USD/JPY TECHNICAL ANALYSIS
Looking at the 21-day simple moving average (SMA) based Bollinger Band and a series of SMAs, USD/JPY might be at a crossroads and the next week or so could be vital for direction.
After a recent sell-off that broke below the lower band of the 21-day simple moving average (SMA) based Bollinger Band, the price moved back inside the band.
Sideways price action has unfolded since then and it might signal that the bearish run has paused and may open the possibility of a reversal.
The price is currently below the 10-, 21-, 55-, 100- and 200-day SMAs and this may suggest that bearish momentum is evolving. It should be noted though that the 10-day SMA is nearby.
The gradients on the short and medium-term SMA are negative but the longer-term SMAs have positive gradients. Should those latter SMAs roll over, it could indicate further bearish momentum is unfolding.
The 21-day SMA currently coincides with a descending trend line at 131.20 and may also offer resistance.
--- Written by Daniel McCarthy, Strategist for DailyFX.com
To contact Daniel, use the comments section below or @DanMcCathyFX on Twitter


