


Gold Weekly Technical Outlook: Neutral
- Gold prices fall to critical support as trendline resistance caps the upside move .
- USD strength holds XAU/USD back while technical levels firm.

Gold (XAU/USD) Technical Analysis
Gold prices have continued to dwindle as USD strength drives XAU/USD lower. With a strong bearish trend currently intact, a temporary retest of 1622 allowed bulls to push prices higher before running into resistance at 1738.7 (trendline resistance).
After a strong decline from the March high of 2078.8, a strong US Dollar and higher rates have continued to weigh on the precious metal, driving prices back towards the 1640 – 1650 zone.
Gold (XAU/USD) Weekly Chart
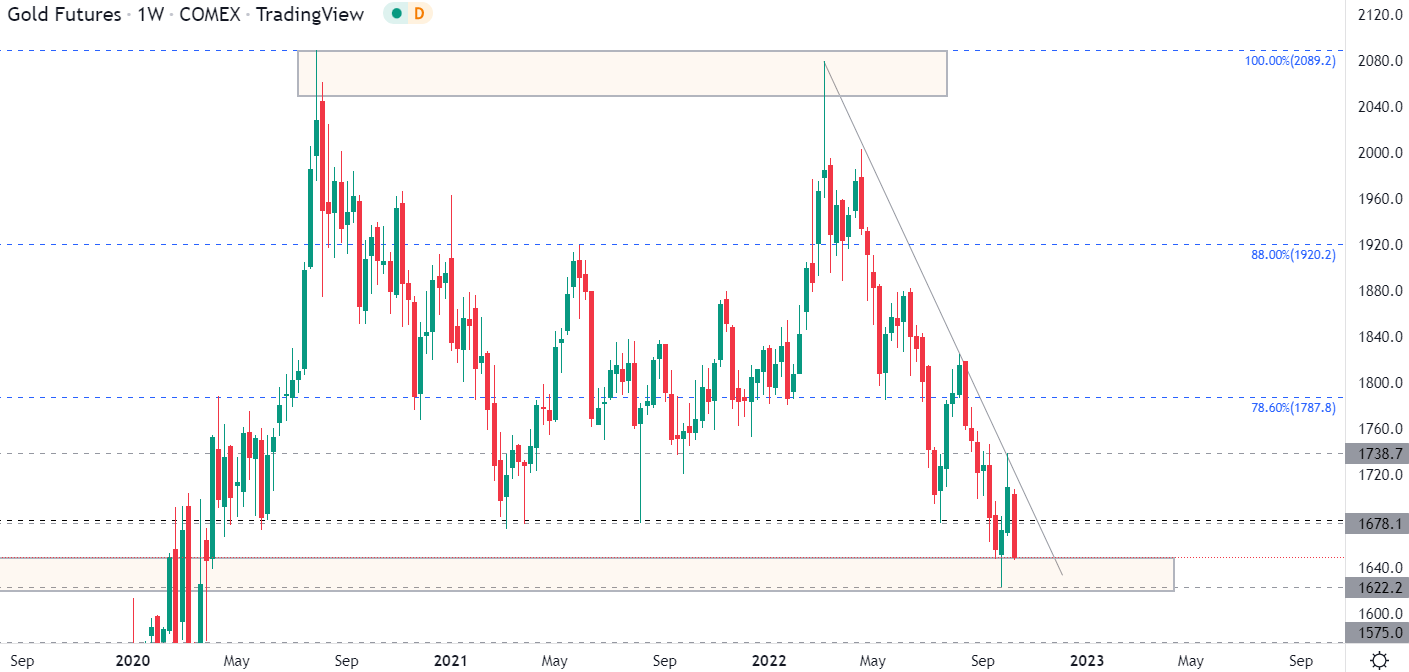
Chart prepared by Tammy Da Costa - TradingView
As key Fibonacci levels continue to provide support and resistance for Gold, a break of the September low of 1622.2 would be required before bears can claim 1600. Meanwhile, with another narrow range forming between 1646 & 1738, a move higher could drive the upside move towards 1800.
Gold (XAU/USD) Daily Chart
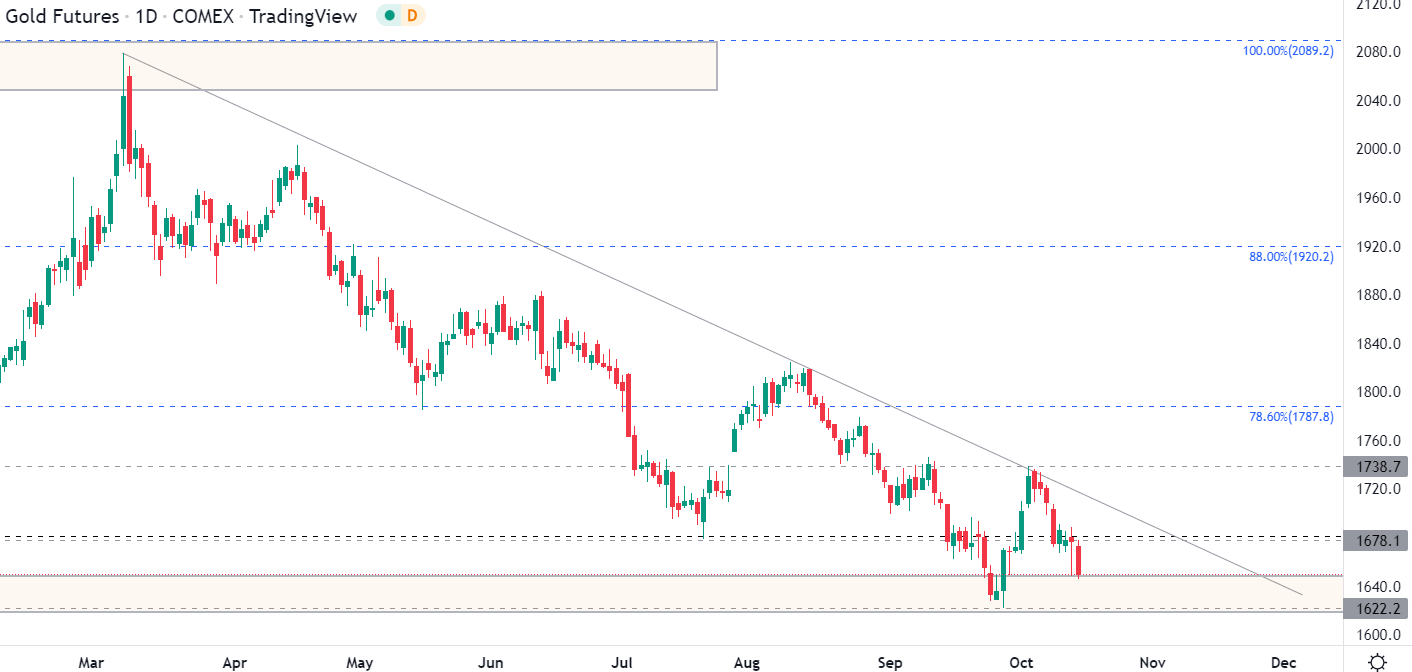
Chart prepared by Tammy Da Costa using TradingView
The remaining question is whether bears can break this support. The zone that runs from 1680-1700 has been in-play multiple times over the past couple of years, ever since gold topped-out in the summer of 2020. However, if prices hold below the psych level of 1650, it could be possible for bears to drive prices back towards 1600.
--- Written by Tammy Da Costa, Analyst for DailyFX.com
Contact and follow Tammy on Twitter: @Tams707


