


Gold, Retail Trader Positioning, Technical Analysis – IGCS Update
- Gold prices remain higher compared to mid-August
- Retail traders continued boosting downside exposure
- Will XAU/USD clear a key technical intersection?

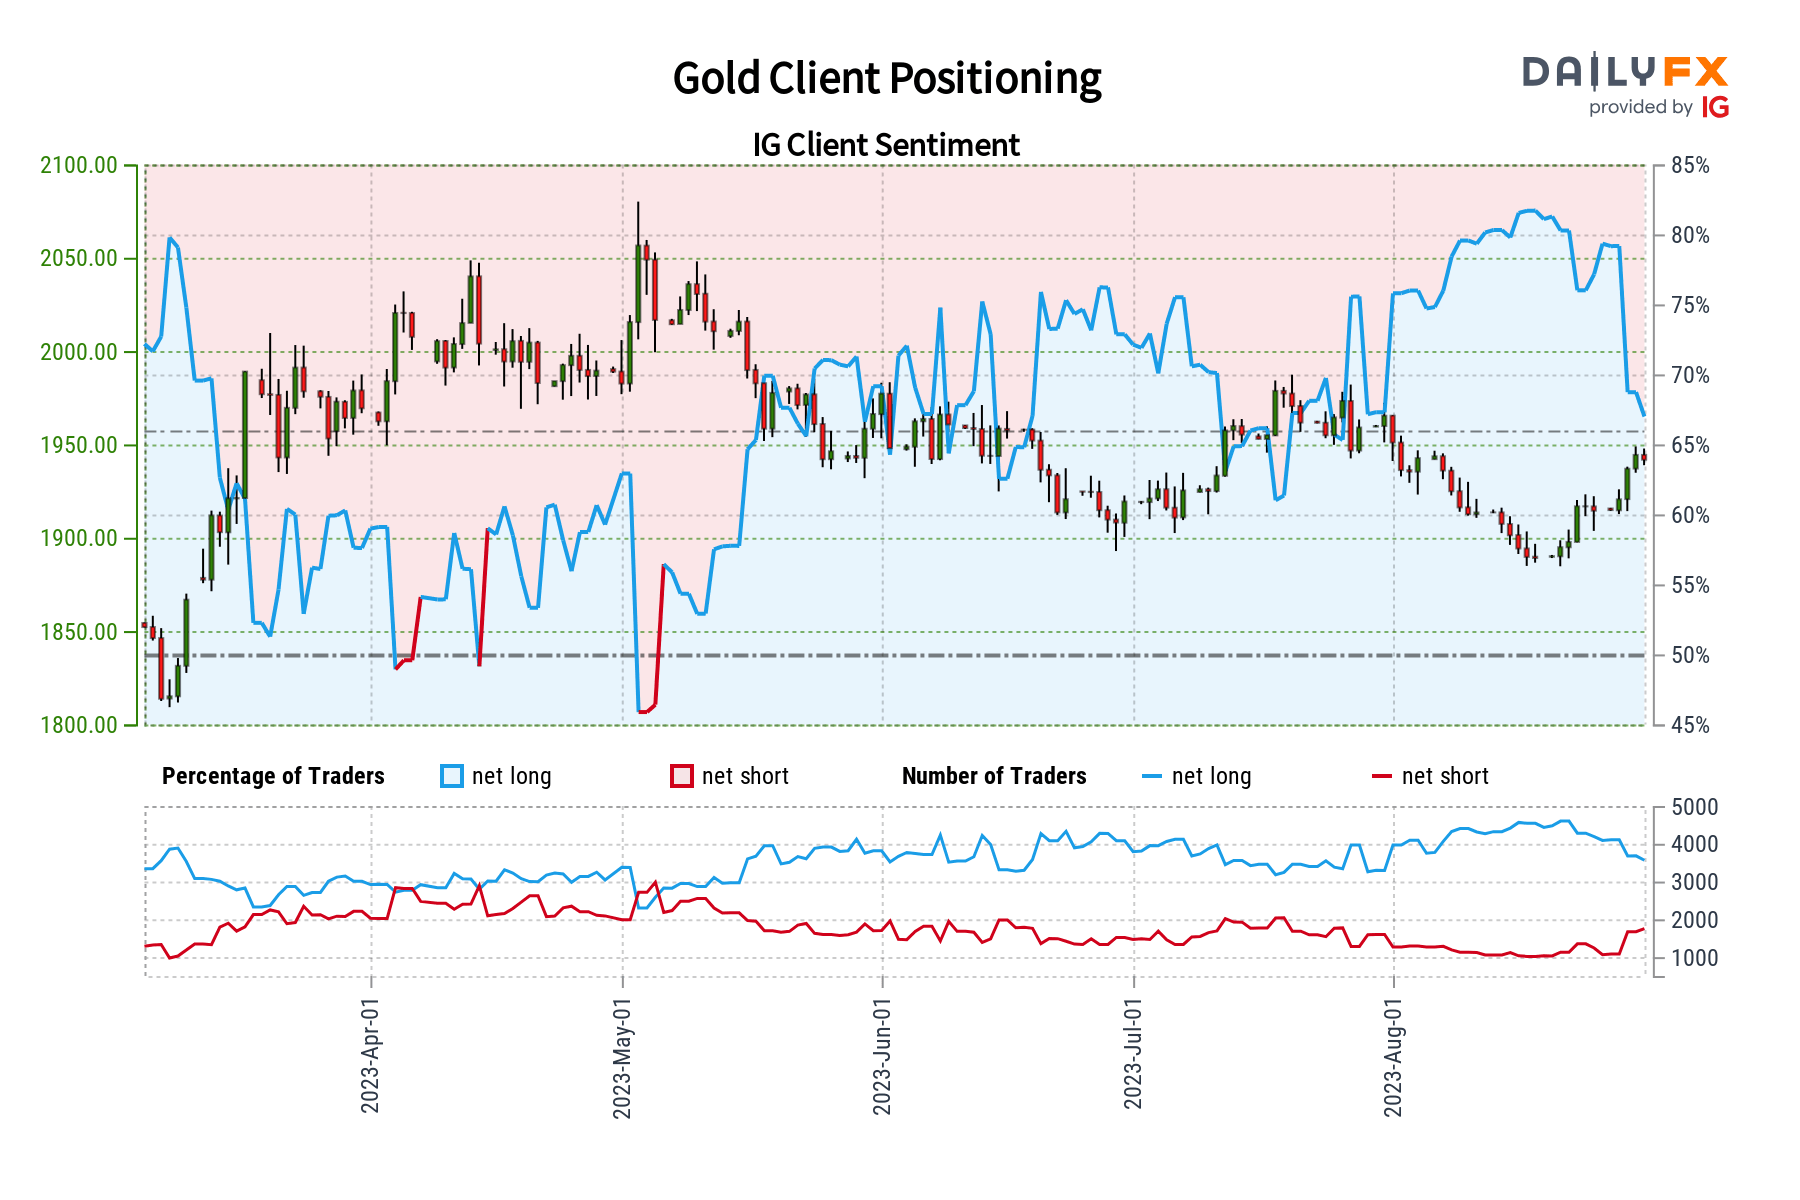
Gold prices remain over 3 percent higher compared to the middle of August. Since then, retail traders have continued to increase downside exposure. This can be seen by taking a look at IG Client Sentiment (IGCS), which often functions as a contrarian indicator. With that in mind, could the yellow metal extend its recent winning streak?
Gold Sentiment Outlook - Bullish
The IGCS gauge shows that about 65% of retail traders are net-long gold. Since most of them are biased to the upside, this continues to hint that prices may decline down the road. But, downside exposure has increased by 4.61% and 42.15% compared to yesterday and last week, respectively. With that in mind, despite overall positioning, recent changes in exposure hint that the current price trend may extend higher.
| Change in | Longs | Shorts | OI |
| Daily | -5% | 2% | -2% |
| Weekly | -5% | 14% | 3% |
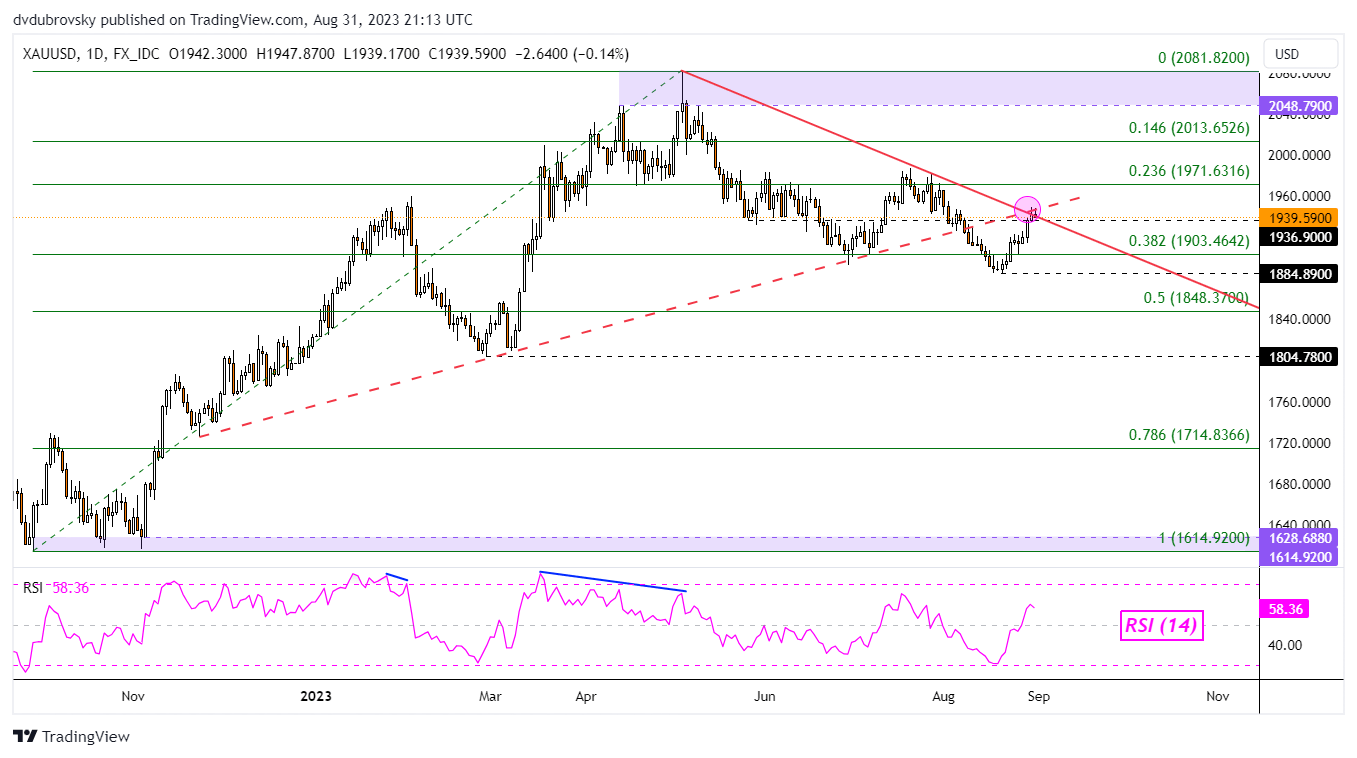
XAU/USD Daily Chart
On the daily chart, gold prices are facing the next critical technical test. It is the intersection of a falling trendline from May and former rising support from the end of last year – highlighted as the pink circle in the daily chart below. A hold at resistance would open the door to extending the downtrend since earlier this year.
That would place the focus on near-term support which is the 38.2% Fibonacci retracement level of 1903.46. Beyond that sits the August swing low of 1884.89. Clearing the latter opens the door to resuming broader losses since May. Otherwise, pushing above resistance offers an increasingly bullish technical outlook, placing the focus on the 23.6% Fibonacci retracement level of 1971.63.
-- Written by Daniel Dubrovsky, Senior Strategist for DailyFX.com


