


Gold, XAU/USD, Silver, XAG/USD - Technical Outlook:
- Gold is hovering around major 1675-1685 support.
- Silver has retreated from key resistance.
- What is the outlook and what are the key levels to watch?

GOLD SHORT-TERM TECHNICAL OUTLOOK - NEUTRAL
Gold’s inability to extend gains this month and the retreat from stiff resistance is a sign that the yellow metal is not out of the woods. At the same time, the downside appears to be cushioned for now, pointing to a range developing in the near term.
XAU/USD Daily Chart
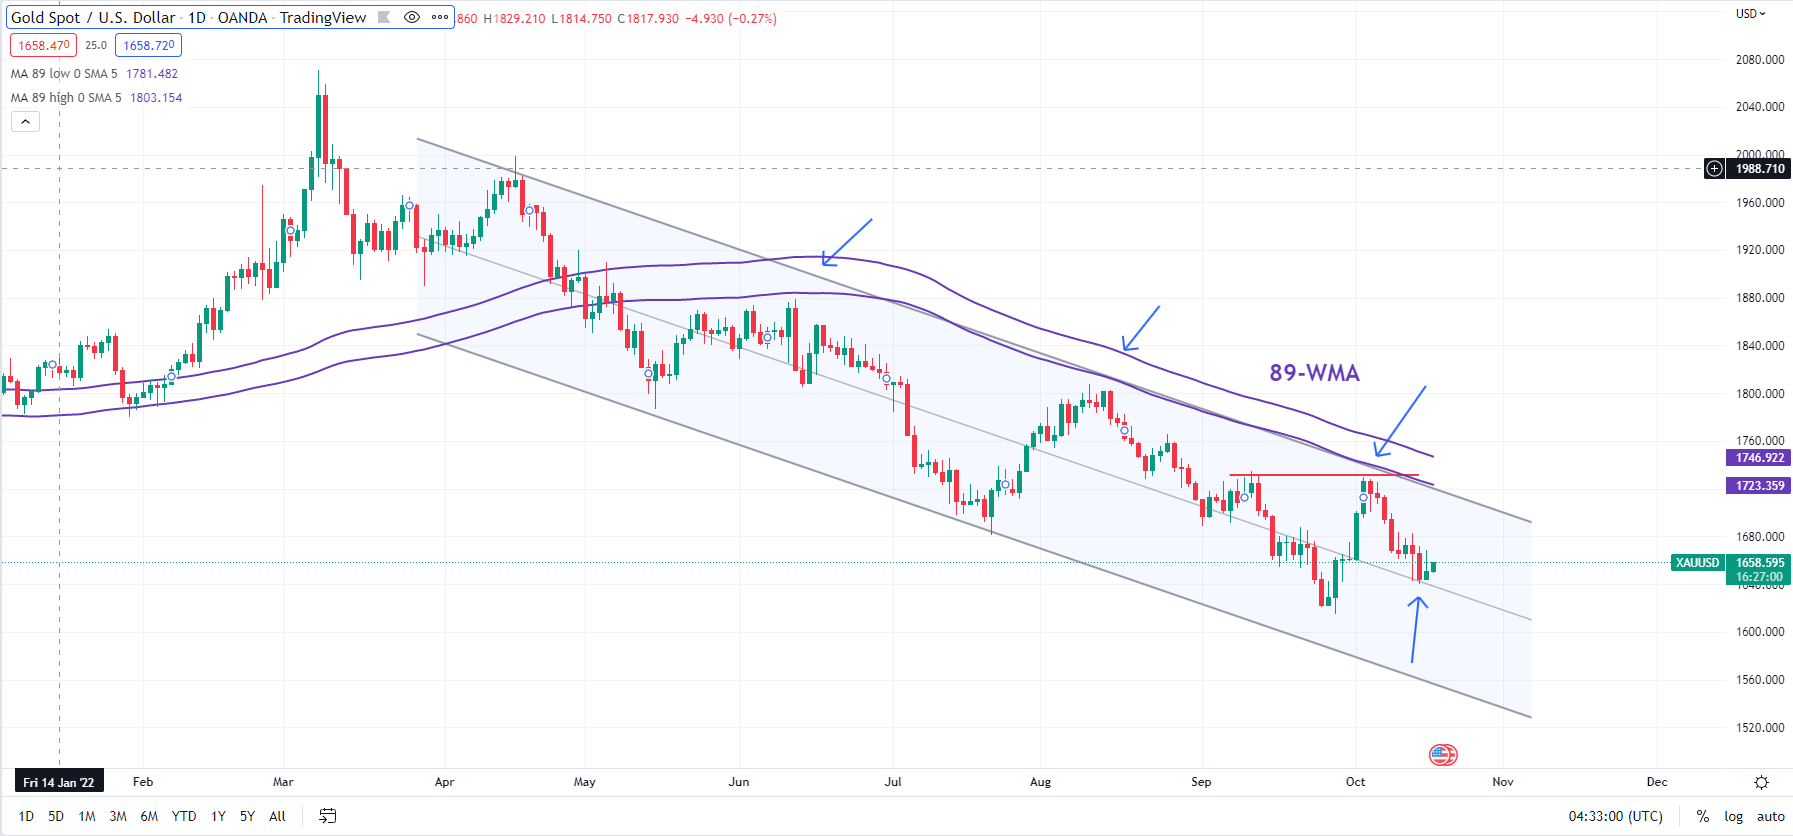
Chart Created Using TradingView
XAU/USD has retreated from key converged resistance: the mid-September high of 1735, coinciding with the 89-day moving average and the upper edge of a declining channel from April (see chart). Gold is now holding above support on the midpoint of the channel, potentially forming a 1610-1750 range in the near term.
XAU/USD Weekly Chart
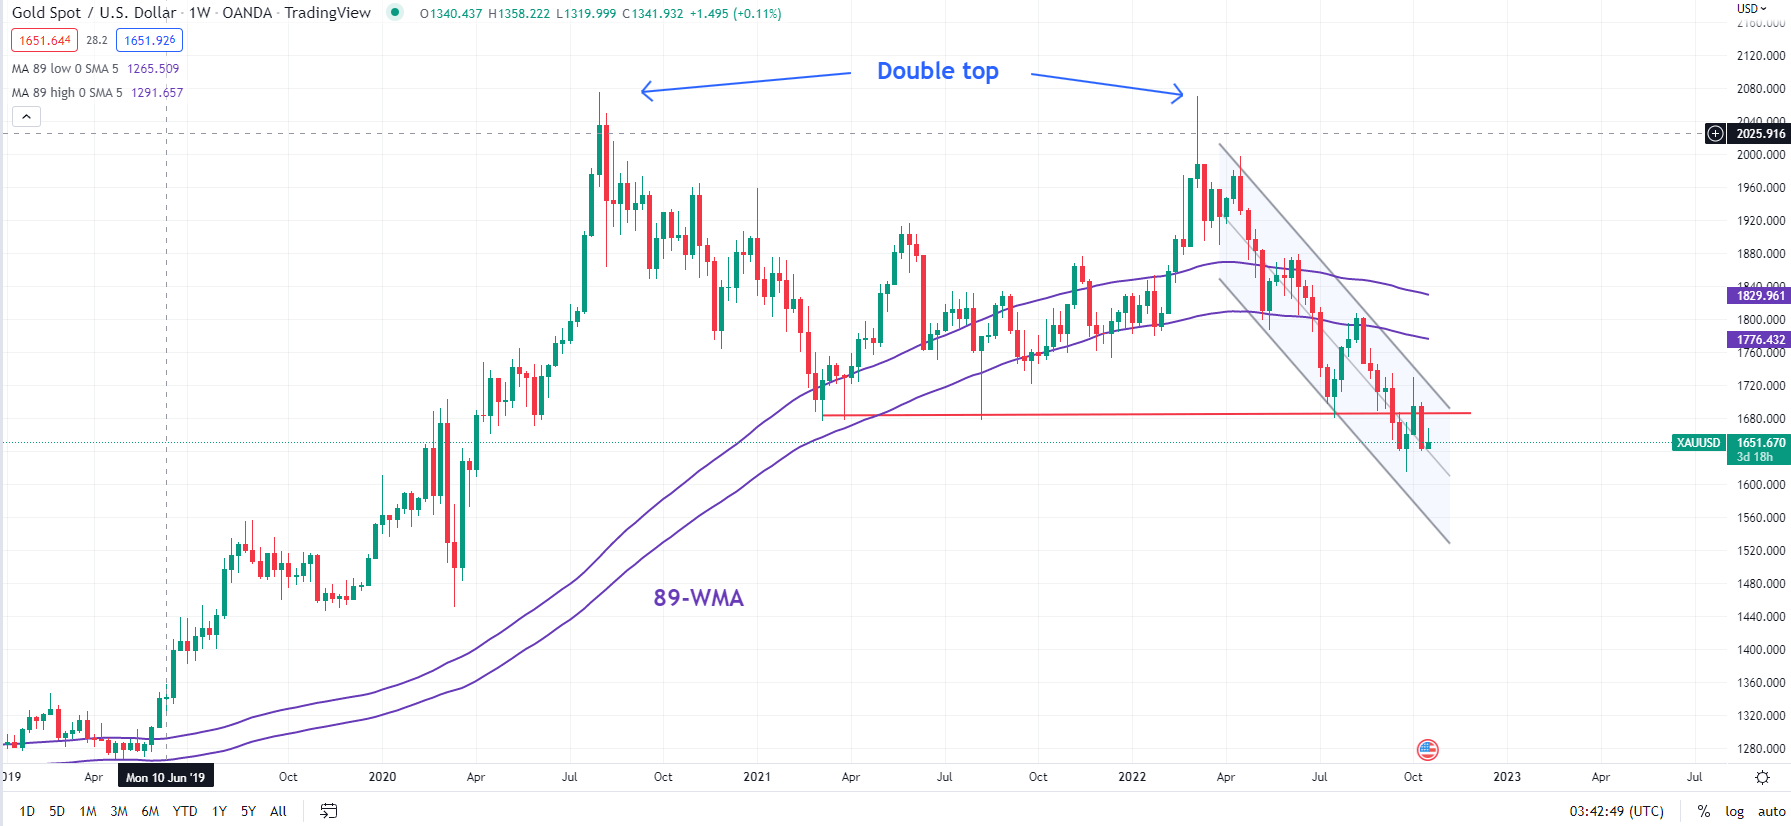
Chart Created Using TradingView
Still, the overall the bias for gold remains down. On the weekly chart, gold has been flirting with crucial support on a horizontal trendline from 2021 at about 1675-1685, which in a way is unsurprising given the significance of the support – a potential major Double Top formation (the 2020 and 2022 highs). The price objective if the pattern were to trigger would point to substantial weakness in the subsequent weeks and months.

SILVER SHORT-TERM TECHNICAL OUTLOOK - NEUTRAL
Silver’s failure earlier this month to break above key resistance highlights that the precious metal remains in a range at best for now.
XAG/USD retreated from near tough resistance at the at the August high of 20.85, slightly below resistance on a horizontal trendline from late 2020 at about 21.50. Moreover, momentum on the weekly charts hardly budged despite the sharp intraweek rally in early October. Indeed, the 14-week Relative Strength Index (RSI) has stayed under 50 since the downtrend stalled in July near quite-strong converged support area: the lower edge of a falling channel from 18.13, coinciding with a horizontal trendline from 18.70 (see chart).
XAG/USD Weekly Chart
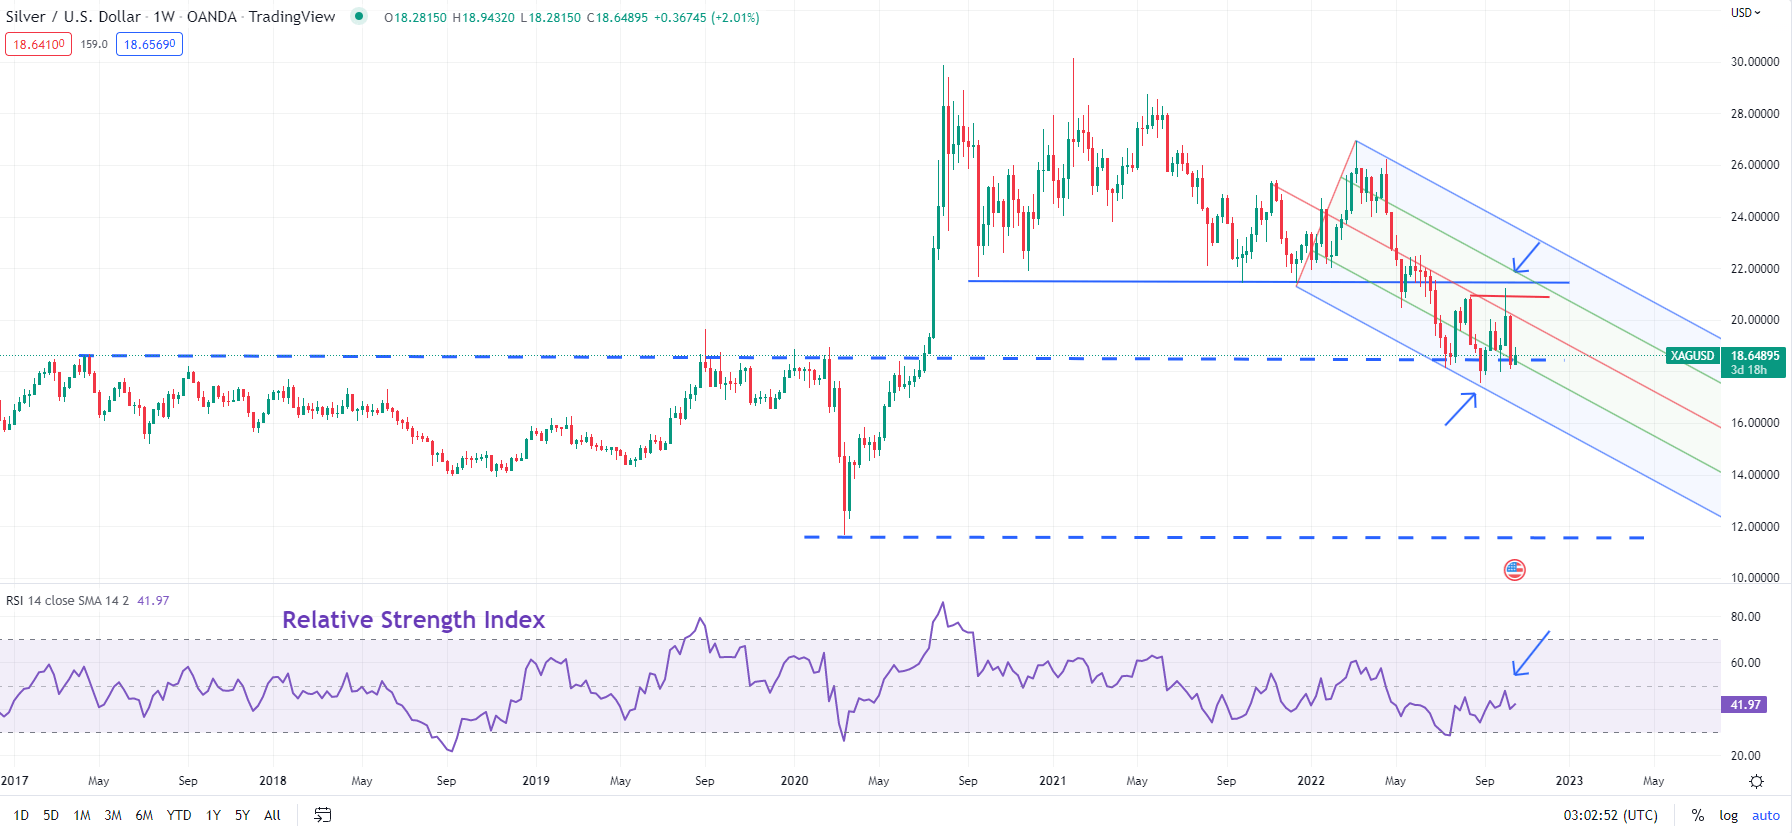
Chart Created Using TradingView
Furthermore, the inability of momentum to rise meaningfully is also a sign of a bear market rally. Typically, in such corrective rebounds, the RSI tends to be capped under 50-60 levels.
While the broader downtrend remains intact, the sideway price action in Silver could continue in the short term. XAG/USD needs to break below support at the September low of 17.50 for the downtrend to resume. That could pave way towards 15.50 (the 78.6% retracement of the 2020-2021 rise). On the upside, silver needs to clear resistance at 20.85-21.50 at minimum for the medium-term downward pressure to ease.

--- Written by Manish Jaradi, Strategist for DailyFX.com


