


Gold, Silver, Retail Trader Positioning, Technical Analysis – IGCS Commodities Update
- Gold and silver prices have been in a downtrend since May
- Retail traders have responded by boosting upside exposure
- Is this a stronger bearish signal for XAU/USD, XAG/USD?

Gold and silver prices have been in a prolonged downtrend since topping in May. In response, retail traders have been gradually increasing upside exposure in XAU/USD and XAG/USD. This can be seen by looking at IG Client Sentiment (IGCS). IGCS typically functions as a contrarian indicator, especially in trending markets. With that in mind, could further pain be ahead for these precious metals?
Gold Sentiment Outlook - Bearish
The IGCS gauge shows that about 76% of retail traders are net-long gold. Since most of them are biased higher, this hints that prices may fall further. This is as downside exposure decreased by 13.02% and 14.63% compared to yesterday and last week, respectively. With that in mind, the combination of overall positioning and changes in recent exposure offers a stronger bearish contrarian trading bias.

XAU/USD Daily Chart
On the daily chart, gold has been in a near-term downtrend since May. In June, XAU/USD confirmed a breakout under the rising support line from November. That opened the door to an increasingly bearish technical bias. Since then, the price has been stabilizing around the 38.2% Fibonacci retracement level at 1903. A confirmatory downside breakout exposes the midpoint of 1848. Otherwise, near-term resistance seems to be the inflection point at 1936.9.


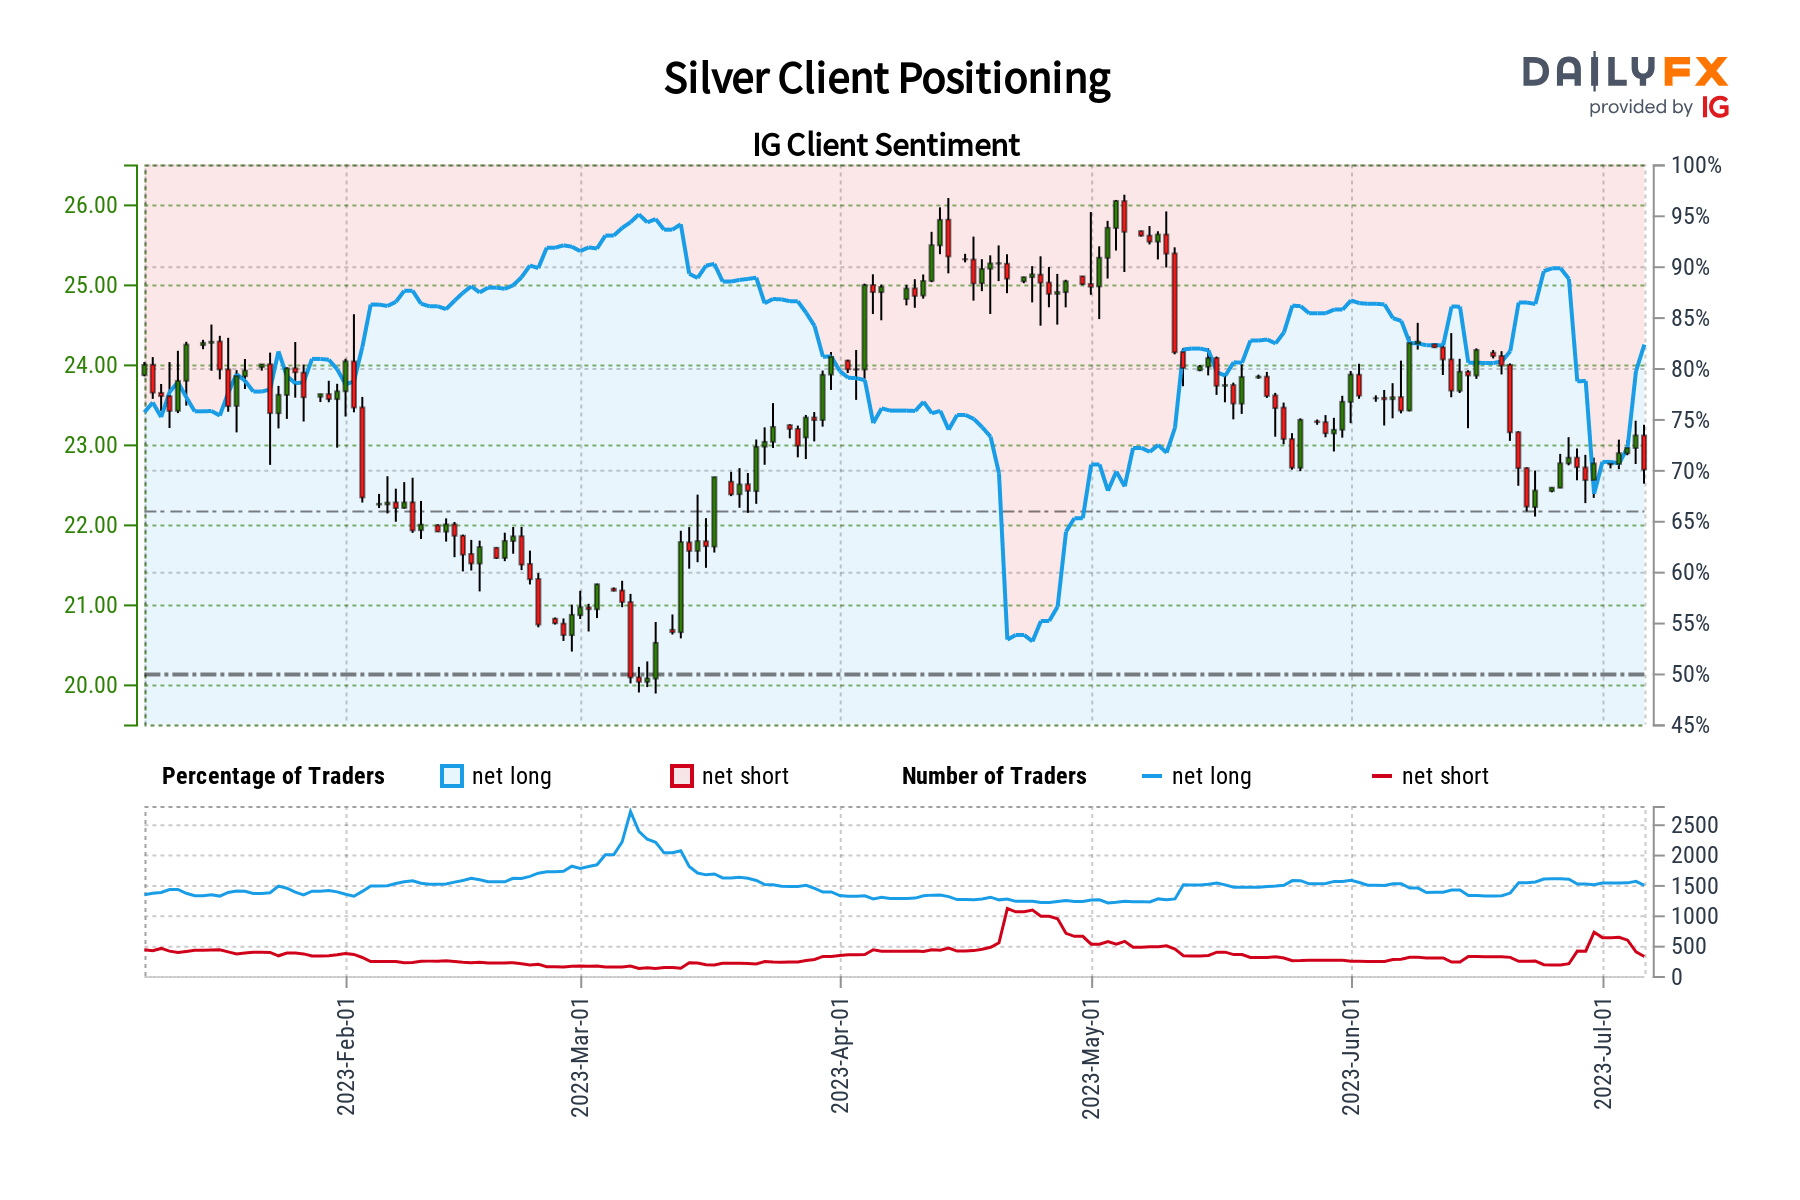
Silver Sentiment Outlook - Bearish
The IGCS gauge displays that roughly 85% of retail traders are net-long silver. Since the majority are biased to the upside, this hints prices may continue lower down the road. This is as downside exposure declined by 12.89% and 60.60% compared to yesterday and last week, respectively. With that in mind, the combination of recent changes and overall exposure offers a stronger bearish contrarian trading bias.

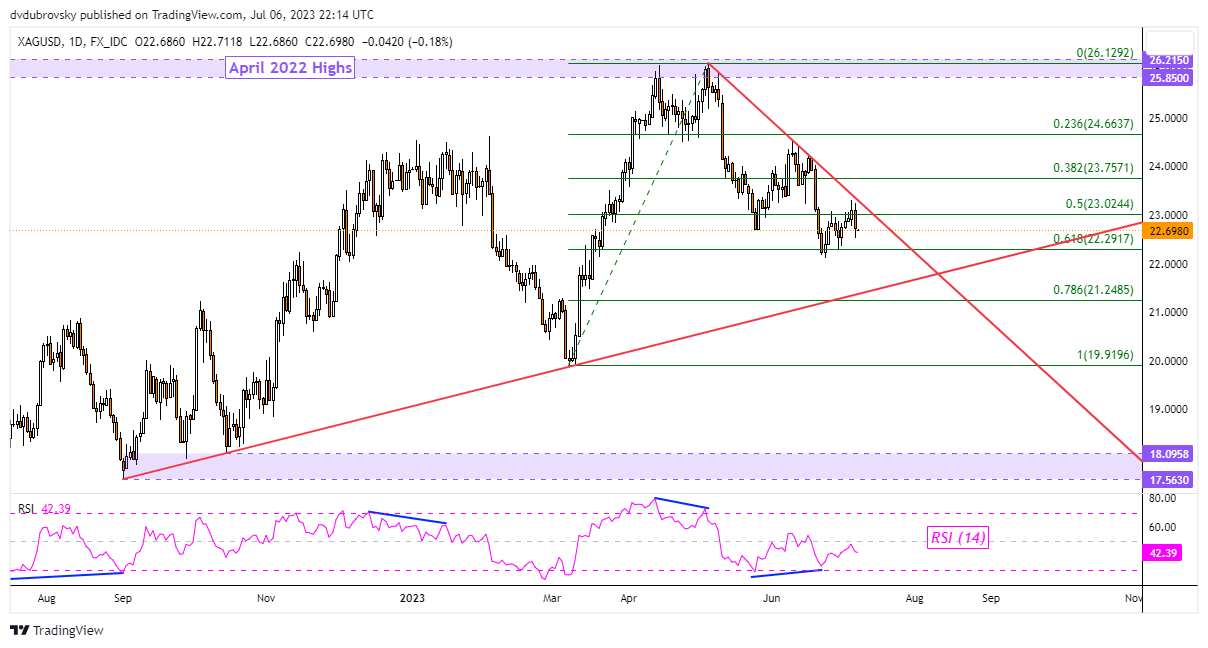
XAG/USD Daily Chart
Looking at the daily chart, silver remains in a downtrend as well. The difference with gold is that XAG/USD remains long-term biased upward by rising support from September. That said, a falling trendline from May is holding as resistance, maintaining the near-term downtrend. Immediate support as the 61.8% Fibonacci retracement level at 22.29. Clearing this price exposes rising support. Otherwise, breaking above falling resistance releases the 38.2% level at 23.75.
-- Written by Daniel Dubrovsky, Senior Strategist for DailyFX.com


