FTSE 100, Dow Jones 30, Nasdaq 100 Daily Prices, Analysis, and Charts
You can download our brand new Q2 Equities Forecast below:

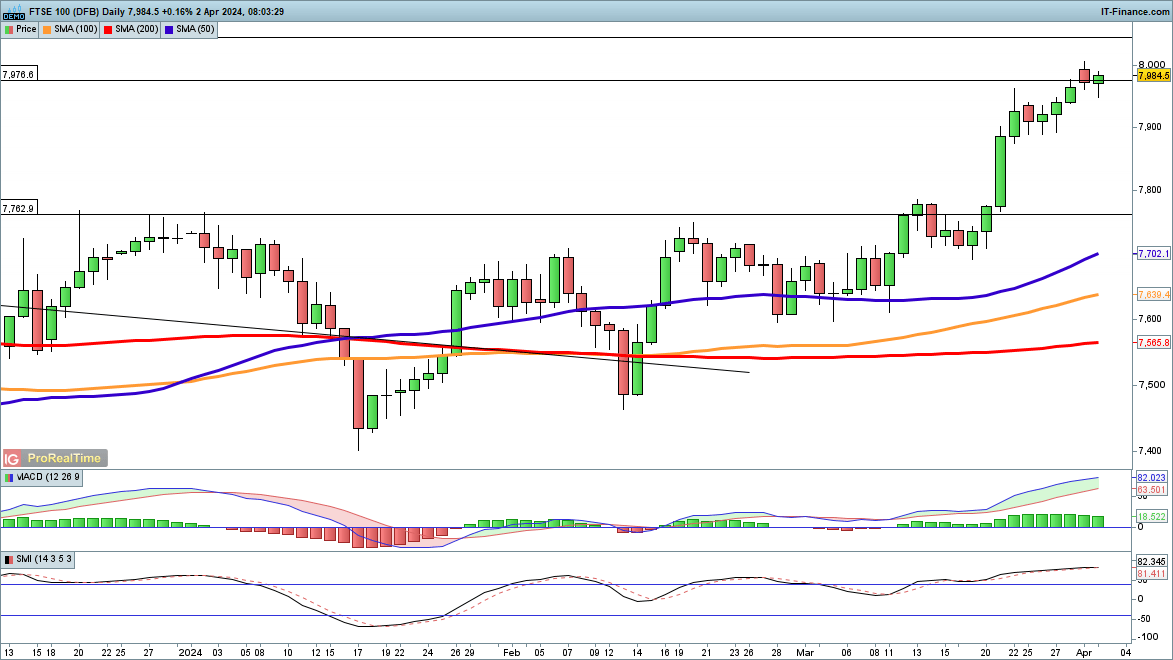
FTSE 100 on a high after solid Q1 gains
The index begins the new month and quarter close to the 8000 level, after an impressive recovery from the lows of January.The record high from February 2023 at 8045 is now in sight, though the price has also slipped below the 7976 high from March last year.
Short-term support could be found around 7885, while a deeper pullback targets 7763.
FTSE 100 Daily Chart
Dow shies away from 40,000
Monday’s session saw the Dow pull back from another record high, as 40,000 continues to elude the index for the time being.Potential horizontal support at the previous high of 39,287 may now be tested, while below this is rising trendline support from early January.
Psychological resistance at 40,000 continues to be the main target for the index in any upward move.
DowJones Daily Chart


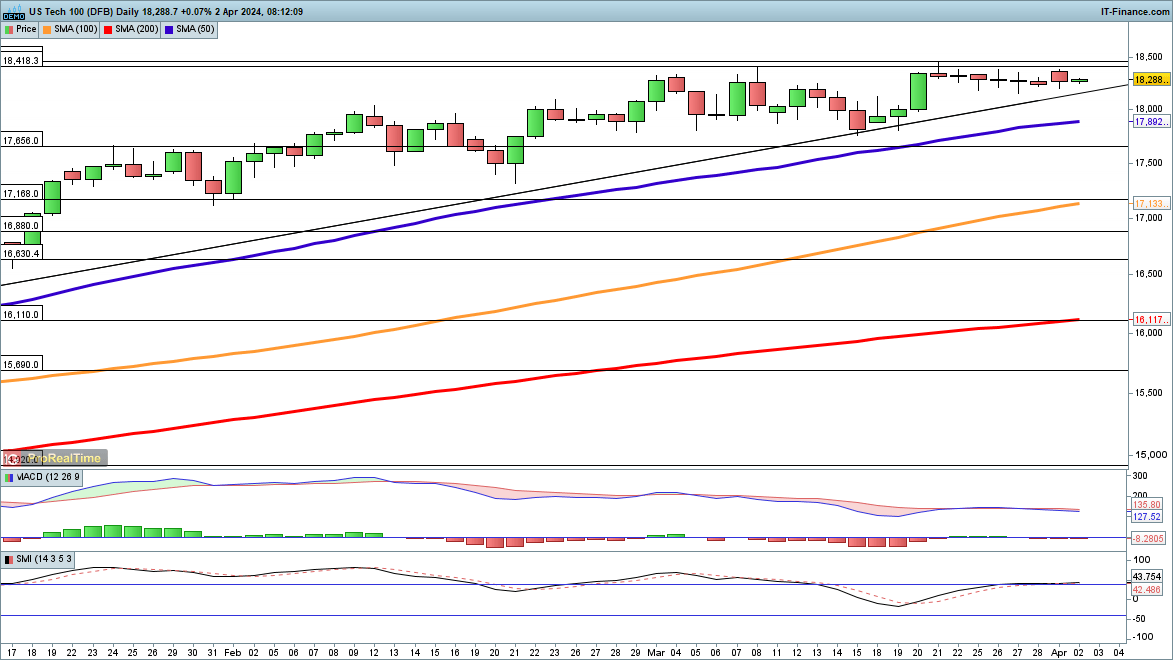
Nasdaq 100 drifts sideways
The sideways price action continues here, as the index fell back from Monday’s high even as buyers have appeared to forestall any downside.The index remains close to the recent record high at 18,466, maintaining the overall uptrend, even if upward progress has been lacking over the past two weeks.
Trendline support from early January remains in place, while below this is the March low at 17,805.
Nasdaq 100 Daily Chart