
US DOLLAR FORECAST – GOLD, EUR/USD, USD/JPY
- The U.S. dollar extends its rebound as Treasury yields accelerate higher
- Market expectations for a Fed interest rate cut in March continue to dwindle
- This article focuses on the technical outlook for gold, EUR/USD and USD/JPY
Trade Smarter - Sign up for the DailyFX Newsletter
Receive timely and compelling market commentary from the DailyFX team
Most Read: S&P 500 Forges Bearish Double-Top Pattern as Higher Yields Weigh on Stocks
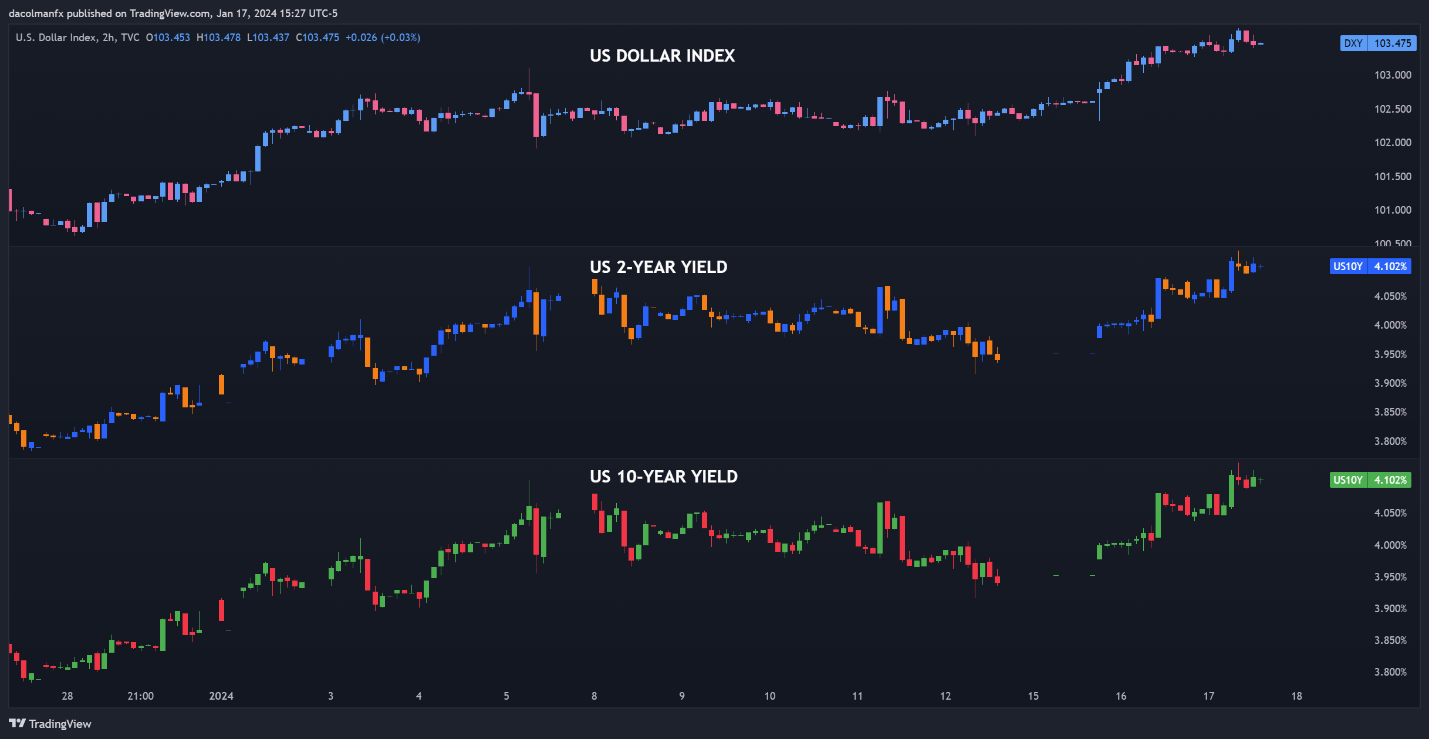
The U.S. dollar, as measured by the DXY index, extended its recovery, reaching its strongest level in more than a month at one point in Wednesday’s trading session, supported by the solid jump in U.S. government bond yields, with the 10-year note pushing past its 200-day simple moving average and settling above 4.10%.
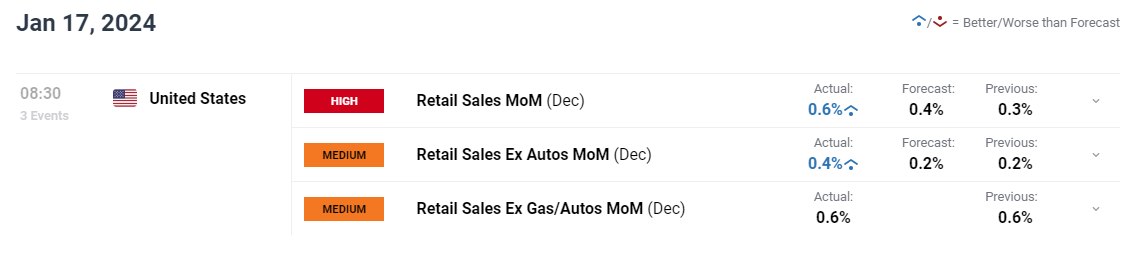
Yields accelerated higher following strong December U.S. retail sales, which surprised on the upside at 0.6% m-o-m versus the 0.4% expected, a clear indication that the consumer maintains generous spending habits and remains in good health. In this environment, the likelihood of recession is very low.
US DOLLAR INDEX VS US YIELDS
Source: TradingView
With the U.S. economy holding up remarkably well and experiencing above-target inflation, the Fed will be reluctant to start lowering borrowing costs prematurely or to slash rates too aggressively, as such a scenario could complicate the path to price stability.
Markets are slowly adjusting to the idea that the U.S. central bank may not pull the trigger too soon in terms of policy easing. To provide context, earlier this year, traders assigned an 80% probability to the first cut arriving in March, but the likelihood of this occurrence has since dwindled to around 50%.
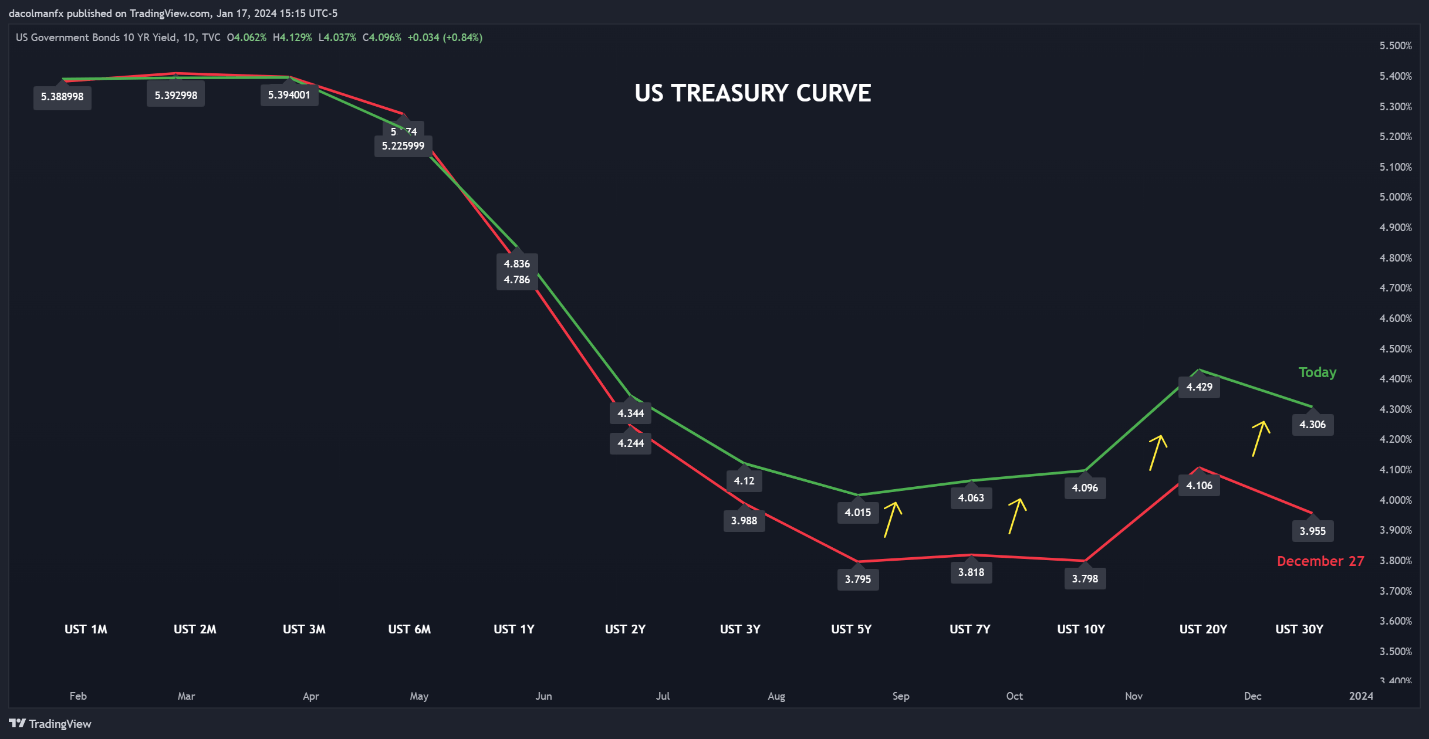
The hawkish repricing of the Fed's path has caused an upward shift in the Treasury curve, as seen in the chart below, reinforcing the greenback’s recovery in the process. This move may have gas to run a bit higher so it would not be surprising to see additional gains for the U.S. dollar in the near term.
For a complete overview of the U.S. dollar’s technical and fundamental outlook, request your complimentary Q1 trading forecast now!

US TREASURY CURVE SHIFTS UPWARDS
Source: TradingView
Wondering how retail positioning can shape gold prices? Our sentiment guide provides the answers you are looking for—don't miss out, get the guide now!
| Change in | Longs | Shorts | OI |
| Daily | -3% | 0% | -2% |
| Weekly | 6% | -9% | -2% |
GOLD PRICE TECHNICAL ANALYSIS
Gold extended its retracement on Wednesday, breaking and closing below its 50-day simple moving average – a bearish development for the precious metal. If losses intensify in the coming days, initial support lies at $1,990, followed by $1,975. On further weakness, the focus shifts to the 200-day SMA.
Conversely, if buyers regain the upper hand and trigger a turnaround, initial resistance emerges at $2,010 and $2,045-$2,050 thereafter. Taking out this ceiling could prove difficult, but a decisive breakout could pave the way for a rally toward the late December highs located around $2,085.
GOLD PRICE TECHNICAL CHART
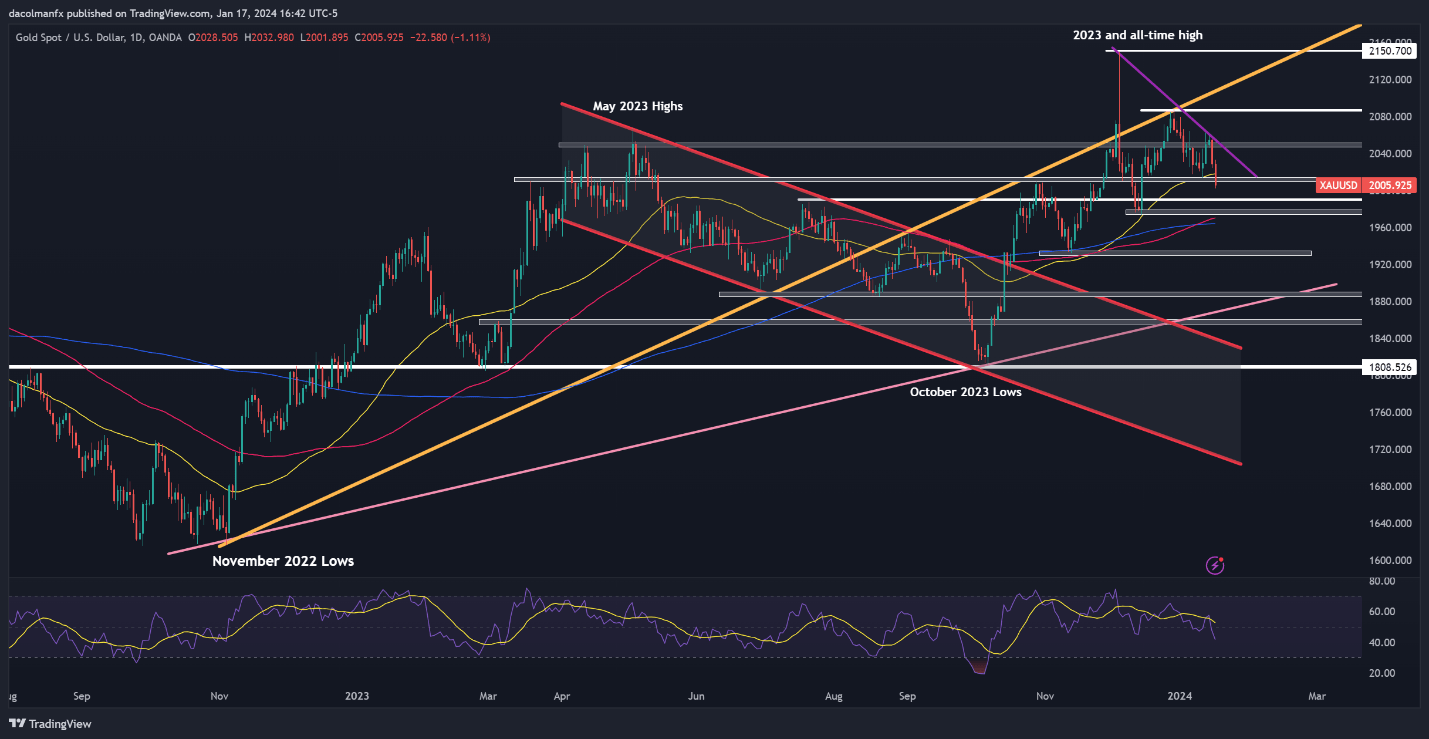
Gold Price Chart Created Using TradingView
Fine-tune your trading skills and stay proactive in your approach. Request the EUR/USD forecast for an in-depth analysis of the euro’s fundamental and technical outlook!

EUR/USD TECHNICAL ANALYSIS
EUR/USD was subdued, but ended the session above its worst levels on Wednesday, after bouncing off its 200-day simple moving average. If prices manage to hold above this indicator, buyers could trigger a move towards 1.0930. Continued gains from this point onward could expose resistance at 1.1020.
On the other hand, if sellers retain control of the market and push the pair below the 200-day SMA, currently positioned at 1.0840, bearish momentum could gather pace, setting the stage for a pullback towards 1.0770. If weakness persists, a move towards trendline support at 1.0700 could follow.
EUR/USD TECHNICAL CHART
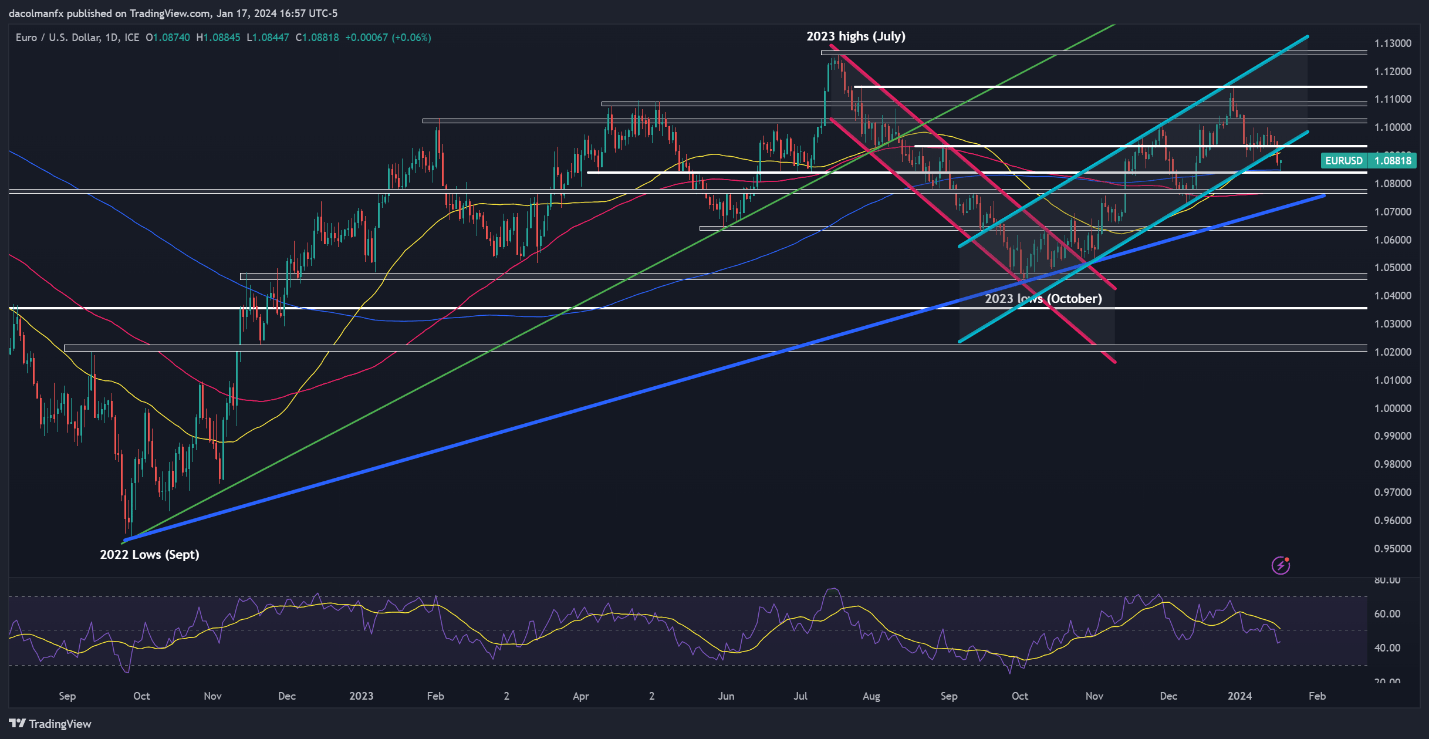
EUR/USD Chart Prepared Using TradingView
Access exclusive insights and strategies for USD/JPY by downloading the Japanese yen trading guide!

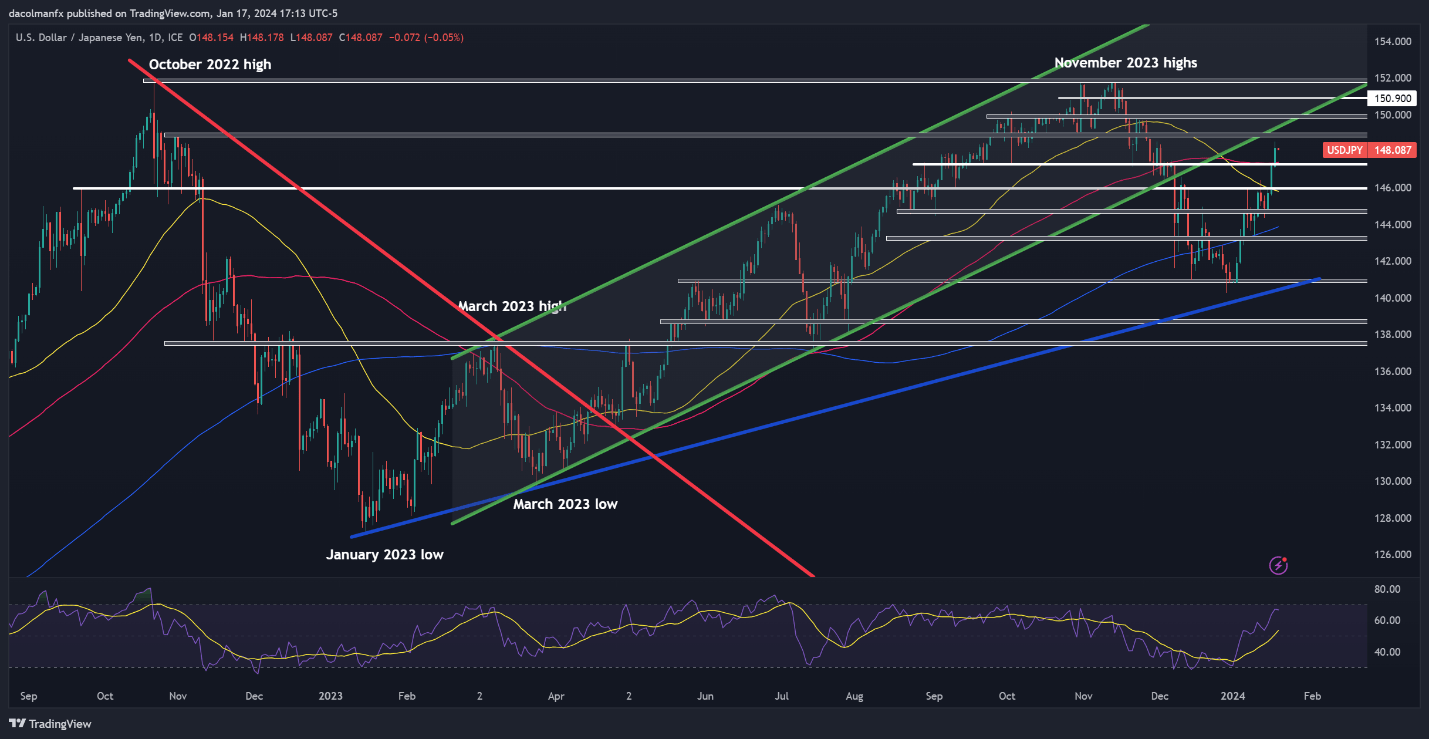
USD/JPY TECHNICAL ANALYSIS
USD/JPY soared past its 100-day SMA on Wednesday, reaching its best level since late November. With sentiment around the yen deteriorating, USD/JPY could soon defy resistance at 149.00. Bulls must protect this ceiling at all costs; failure to do so could lead to a retest of the psychological 150.00 threshold.
On the flip side, if sellers return and push prices lower, the first line of defense against a bearish assault is situated at 147.25, followed by 146.00. The bears are likely to have a hard time driving the pair below this technical zone, but if a breakdown takes place, a rapid decline towards 144.65 could ensue.
USD/JPY TECHNICAL CHART