


Euro, EUR/USD, US Dollar, Fibonacci, Range, Momentum, Trend - Talking points
- The Euro rally is pushing to test some resistance levels but is yet to break the range
- The ascending trend seems intact for now and momentum might be unfolding
- Some critical levels lie ahead. Will EUR/USD break above prior peaks or snap lower?

EUR/USD TECHNICAL ANALYSIS
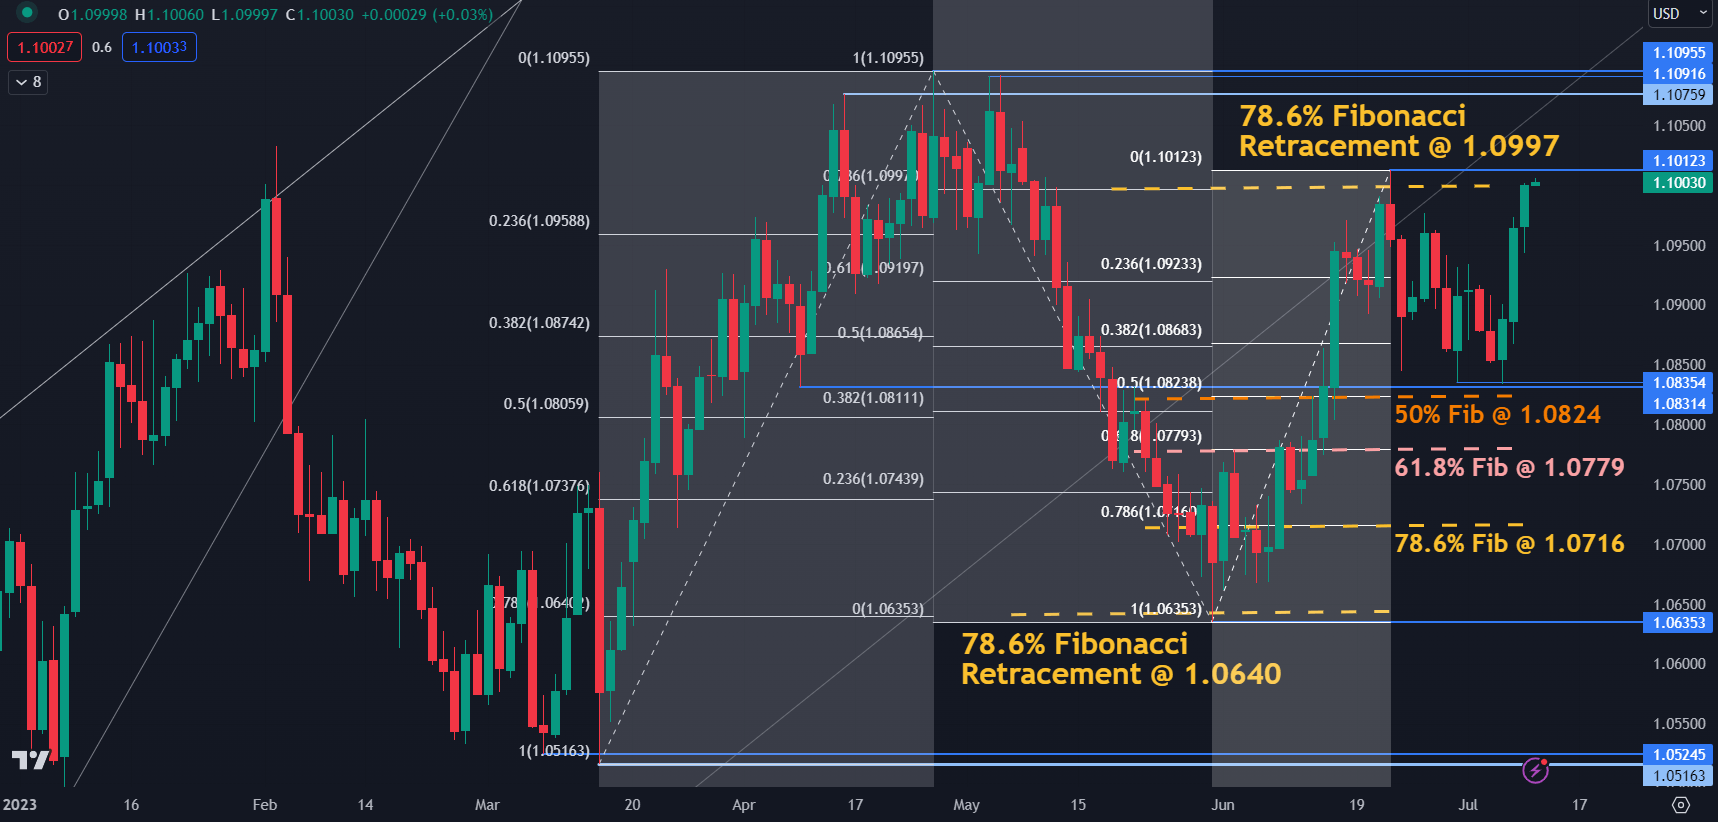
EUR/USD continues to trade in the broad seven-month range of 1.0516 – 1.1096 but it appears that it may challenge the topside after rallying through the last few sessions.
Going into Tuesday, it is testing the 78.6% Fibonacci Retracement of the move from 1.1096 down to 1.0635 at 1.0997. Although it peaked at 1.1012 last month, it was unable to sustain its strength on that occasion.
Those levels may continue to offer resistance ahead of a series of potential resistance levels in the 1.1076 – 1.1096 zone.
On the downside, support could be at the recent low of 1.0844, which is just above the breakpoint of 1.0831.
Further below those levels, there are a series of Fibonacci Retracement levels of the move from 1.0635 up to 1.1012 that might provide support. The 50% Retracement level is at 1.0824, the 61.8% at 1.0779 and the 78.6% is at 1.0716.
The late May low of 1.0635 was only a fraction below the 78.6% Fibonacci Retracement of the move from 1.0516 to 1.1096 at 1.0640. This could make the 1.0635-40 area a possible support zone ahead of the prior lows at 1.0525, 1.0516, 1.0483 and 1.0443.
EUR/USD DAILY CHART OVER THE LAST 6 MONTHS
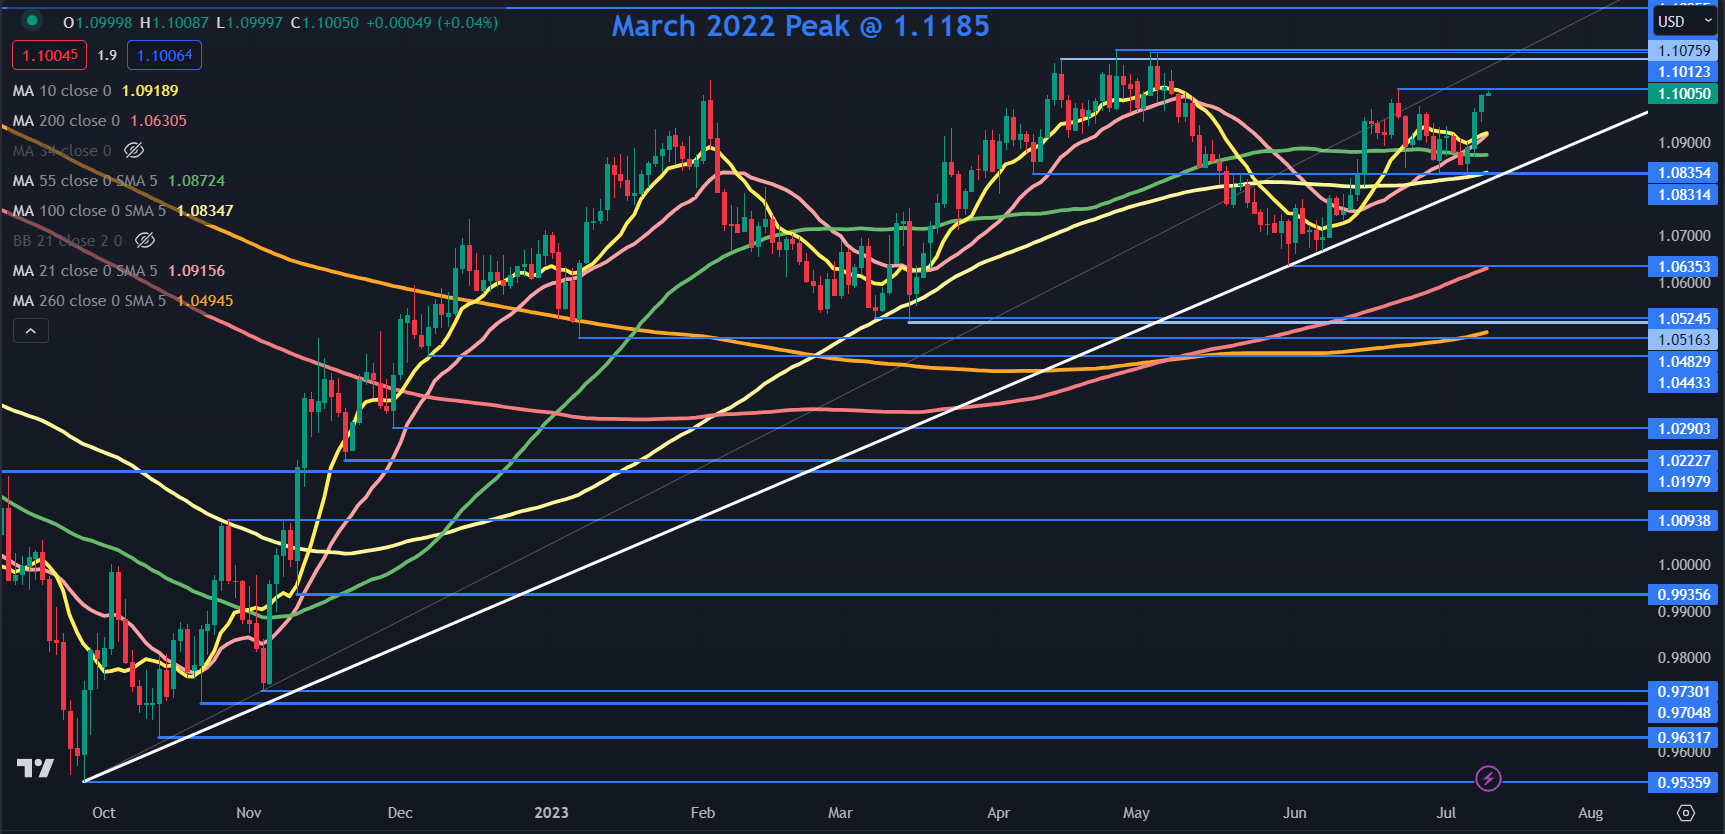
While the chart above highlights the range trading nature for EUR/USD of late, if we zoom out on the timeframe, the currency pair remains above an ascending trendline.
The June high of 1.1096 may offer resistance ahead of the March 2022 peak of 1.1185.
A clean break above these levels might imply that the ascending trend is intact and could see further bullishness evolve.
A bullish triple moving average (TMA) formation requires the price to be above the short-term SMA, the latter to be above the medium-term SMA and the medium-term SMA to be above the long-term SMA. All SMAs also need to have a positive gradient.
The price is currently above the 10-, 21-, 55-, 100-, 200- and 260-day simple moving averages (SMA) and all these SMAs have a positive slope. The criteria for a TMA have been met.
On the downside, a break below the ascending trend line could suggest an end to the bullish trend. Should that occur, the price will also move below a series of SMAs that may reiterate waning bullish momentum.

EUR/USD DAILY CHART OVER THE LAST 9 MONTHS
--- Written by Daniel McCarthy, Strategist for DailyFX.com
To contact Daniel, use the comments section below or @DanMcCathyFX on Twitter


