Dow Jones, S&P 500, Nikkei 225 Analysis and Charts

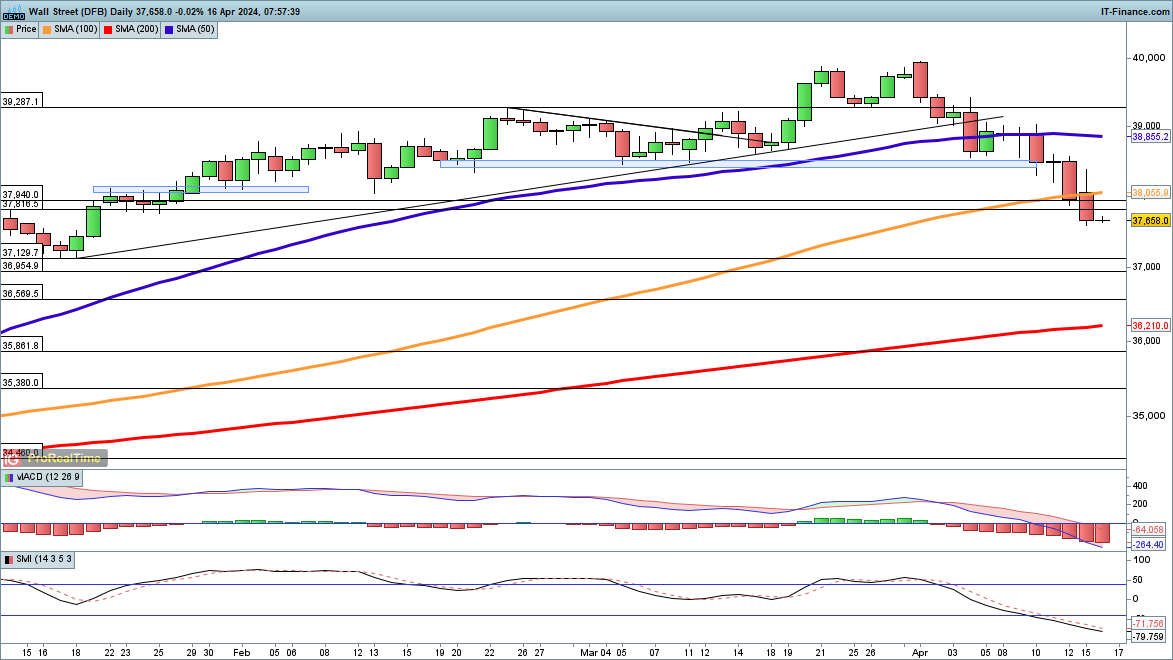
Dow suffers near-6% correction
Further risk-off moves have driven the Dow to its lowest level since mid-January. So far the index is down 5,8% from the highs at the end of March.Further declines would target the 37,129 support level from December and January, while below this comes 36,950, the record high from late 2021.
A close back above the 38,000 level might signal that a low is in place in the short term.
Dow Jones Daily Chart
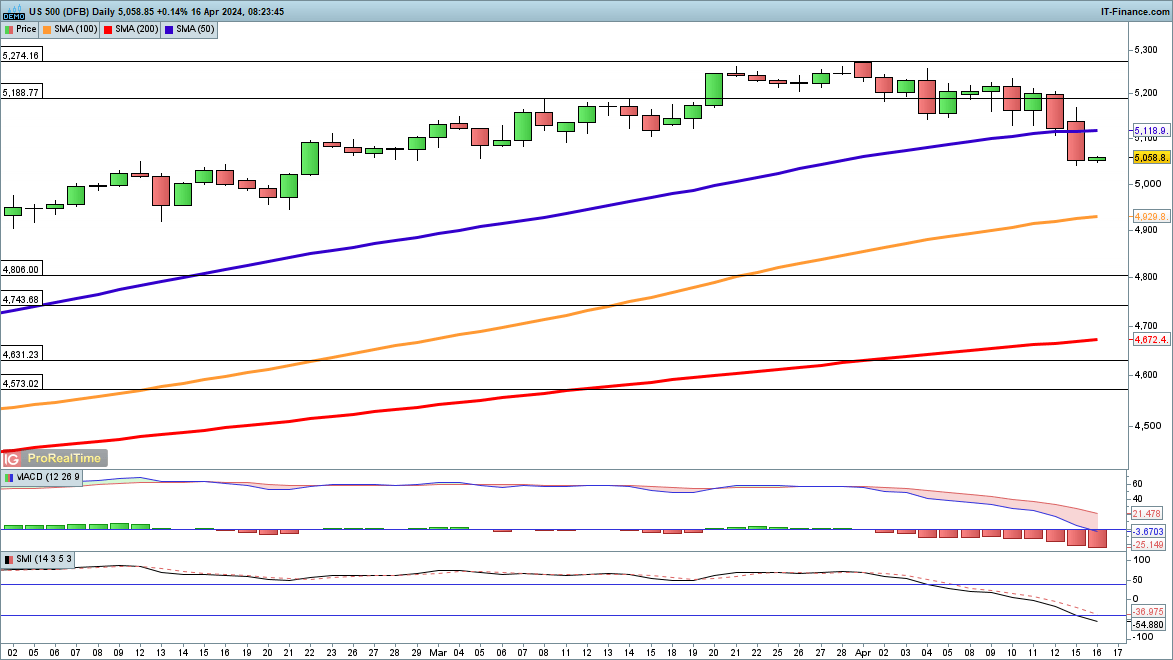
S&P 500 holds above 5000 for now
A slightly more modest pullback has taken place here, and so far the index remains above 5000.In the event of a larger pullback, the price will head towards the 100-day simple moving average (SMA), and then to the previous high at 4806, from 2021.
Buyers have been unable to mount any kind of response to the selling of the previous two sessions, but a recovery above the 50-day SMA might signal that a low is in place.
S&P 500 Daily Chart

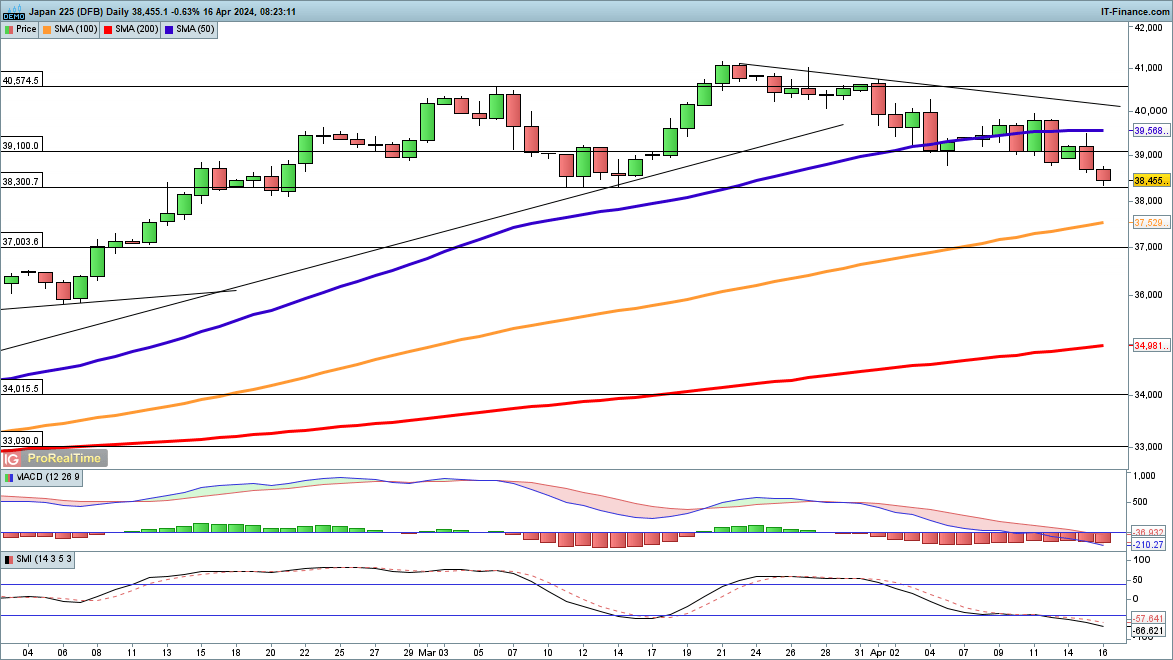
Nikkei 225 at a four-week low
A further run of losses has taken the index back to a one-month low.A close below this level would open the way to 37,000, the high from early January, with the 100-day SMA coming into play before this.
A close above Monday’s high of 39,500 could suggest that a low has formed.
Nikkei 225 Daily Chart