Dow Jones, Nasdaq 100, Nikkei 225 Analysis and Charts
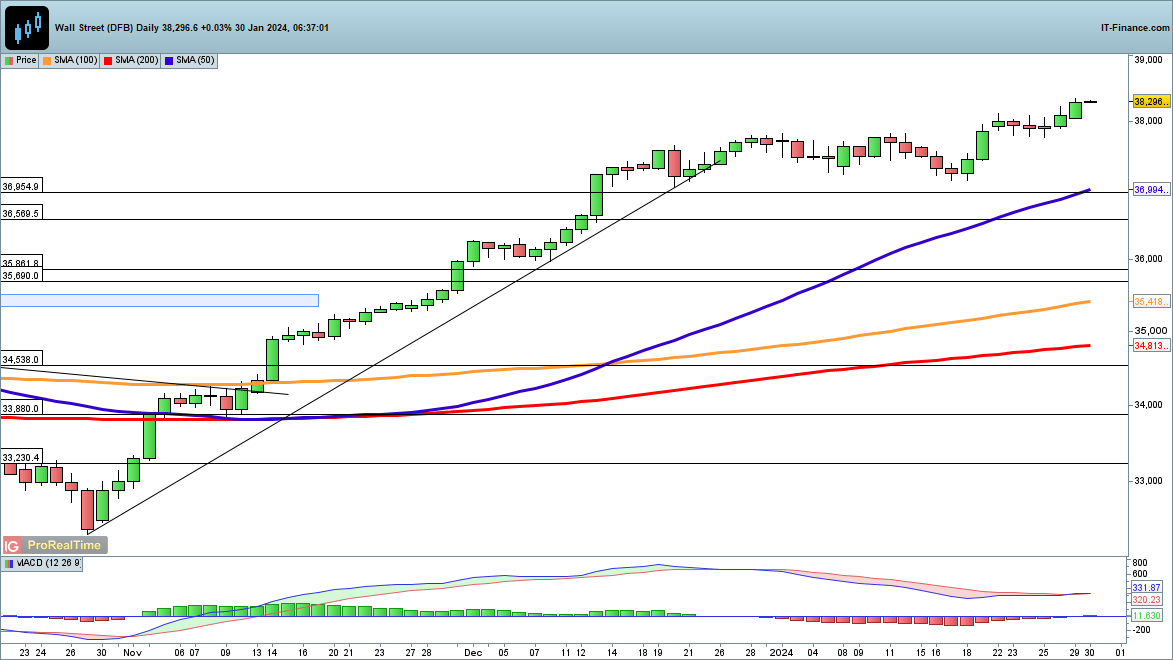
Dow hits new record
The index sits at a new record high, having made further gains on Monday. This marks a continuation of the breakout from 19 January, taking the index further into new territory. Recent weakness from mid-December found buyers at 37,100, so in the short term any weakness may find support around this level.
A deeper retracement may develop if the index closes below the 50-day simple moving average (SMA).
Dow Jones Daily Chart
You can access our free Q1 2024 Equities Technical and Fundamental Forecasts below:

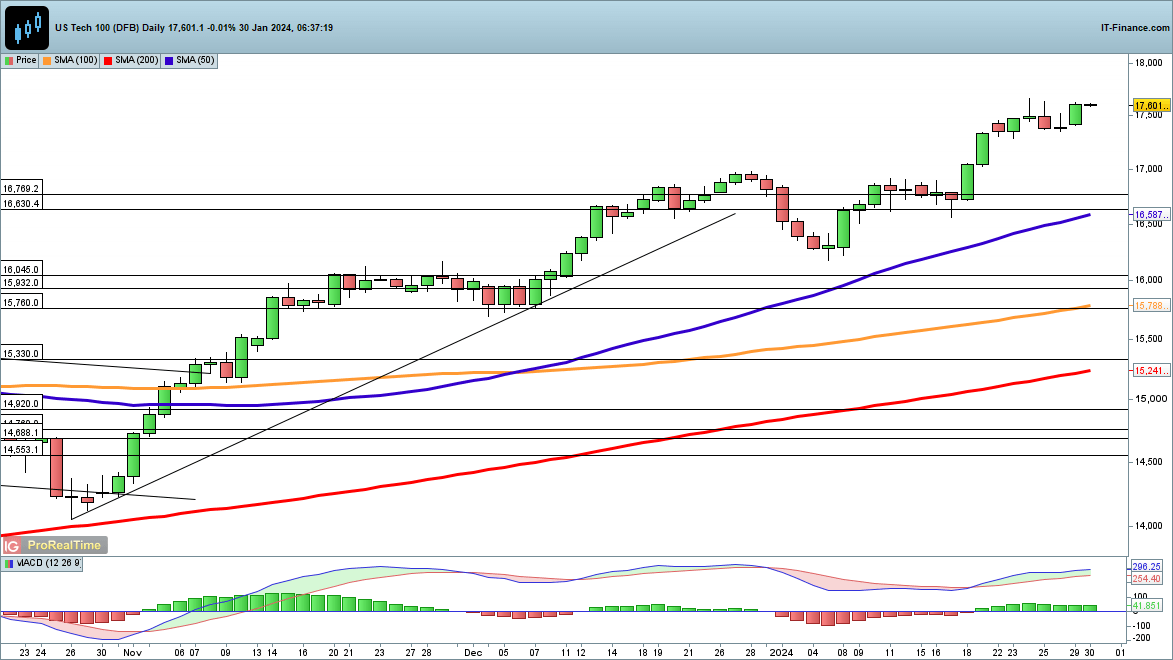
Nasdaq 100 steady ahead of tech earnings
Monday saw the index head back towards last week’s record high, maintaining the leg higher from the early January low. Trendline support from early January could come into play in the event of a pushback towards 17,000. Below this, the 16,630 support area and then the 50-day SMA come into view.
This week could see some volatility return, given the presence of earnings from Microsoft, Alphabet, Apple, Meta, and Amazon on the calendar.
Nasdaq100 Daily Chart


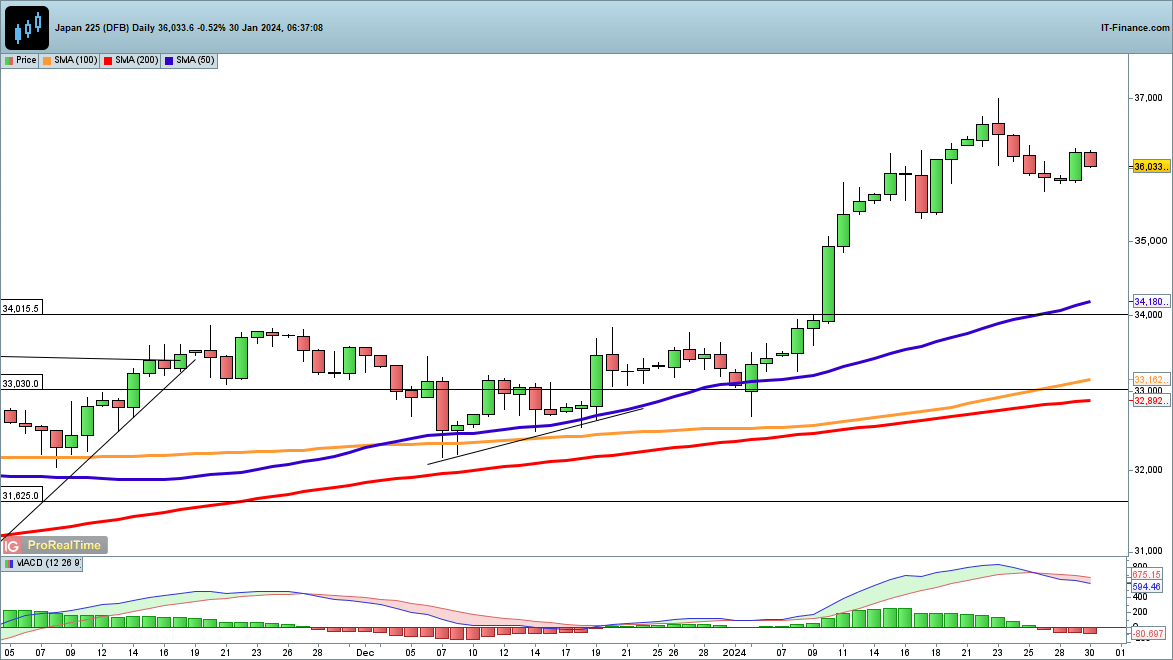
Nikkei 225 turns higher
The new week saw the Nikkei 225 move higher, recouping some of the losses suffered over the past week. Should a new higher low have been formed, then a resumption of the move higher will target 37,000. A close above this then leaves the 1990 high at 38,951 as the last area of potential resistance currently.
Short-term weakness targets the mid-January low of around 35,340.
Nikkei 225 Daily Chart