


US Dollar, DXY, Weekly, Daily – Technical Update:
- US Dollar up about 0.8% this week so far, ready for comeback?
- Weekly bearish breakout losing steam, prices back to resistance
- Watch for key moving averages on the daily chart, will they hold?

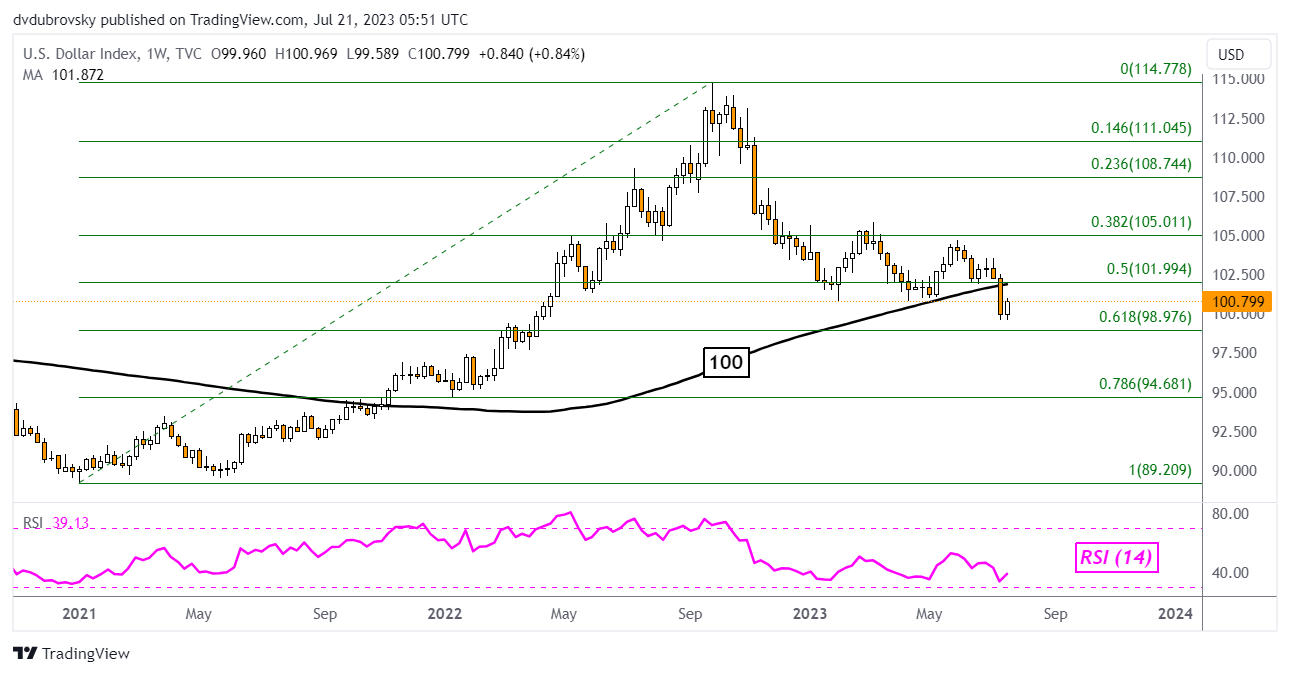
DXY Weekly Chart
The DXY Dollar index fell about 2.3% last week, marking the worst 5-day period since November. Using the weekly setting below, we can get an idea of how prices have behaved since then heading into the end of July. Prices broke under the 100-week Simple Moving Average (SMA). That has opened the door to a broader bearish shift.
That said, an upside close this week could somewhat undermine this breakout. At about 0.8%, that is the most since mid-June. Further confirmation places the focus on the 61.8% Fibonacci retracement level at 98.97. Falling under the latter would offer a stronger broader downside technical bias. We can analyze the daily setting to get a better idea of how prices have been stabilizing of late.
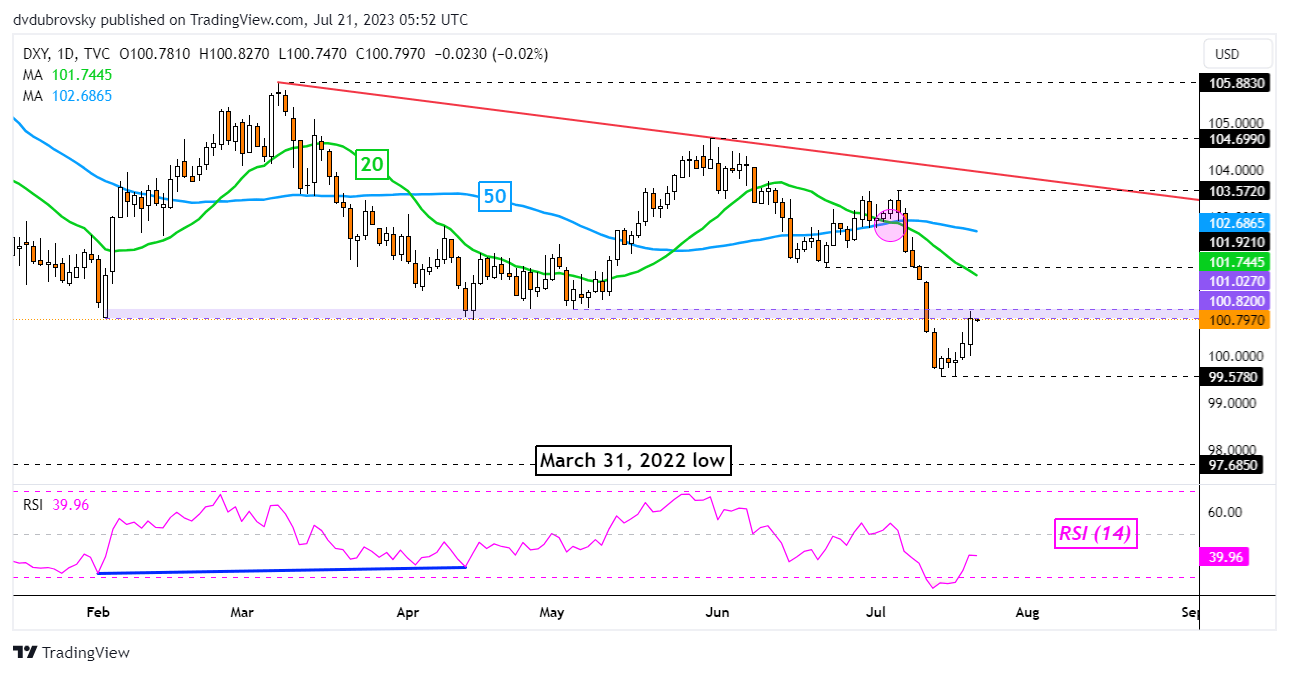
DXY Daily Chart
On the daily chart, the DXY Dollar Index has found a new level of support around 99.57. This followed a breakout under the 100.82 – 101.02 support zone. This range was established back in February and held on multiple occasions in April and May. With Thursday’s ascent, prices are back at this zone which is holding as new resistance.
Piercing through this area opens the door to an extended near-term upward move. That places the focus on the 20- and 50-day SMAs. These could hold as resistance, maintaining the dominant downside bias. Otherwise, a turn lower places the focus back on 99.57. Beyond this price sits the March 31st low at 97.68.
--- Written by Daniel Dubrovsky, Strategist for DailyFX.com


