
Dow Jones, Nasdaq 100, Trendlines, Ascending Triangle – Technical Analysis
- Dow Jones, Nasdaq 100 futures face key technical tests next
- They remain in dominant downtrends despite recent gains
- Will resistance hold? Nasdaq eyeing Ascending Triangle

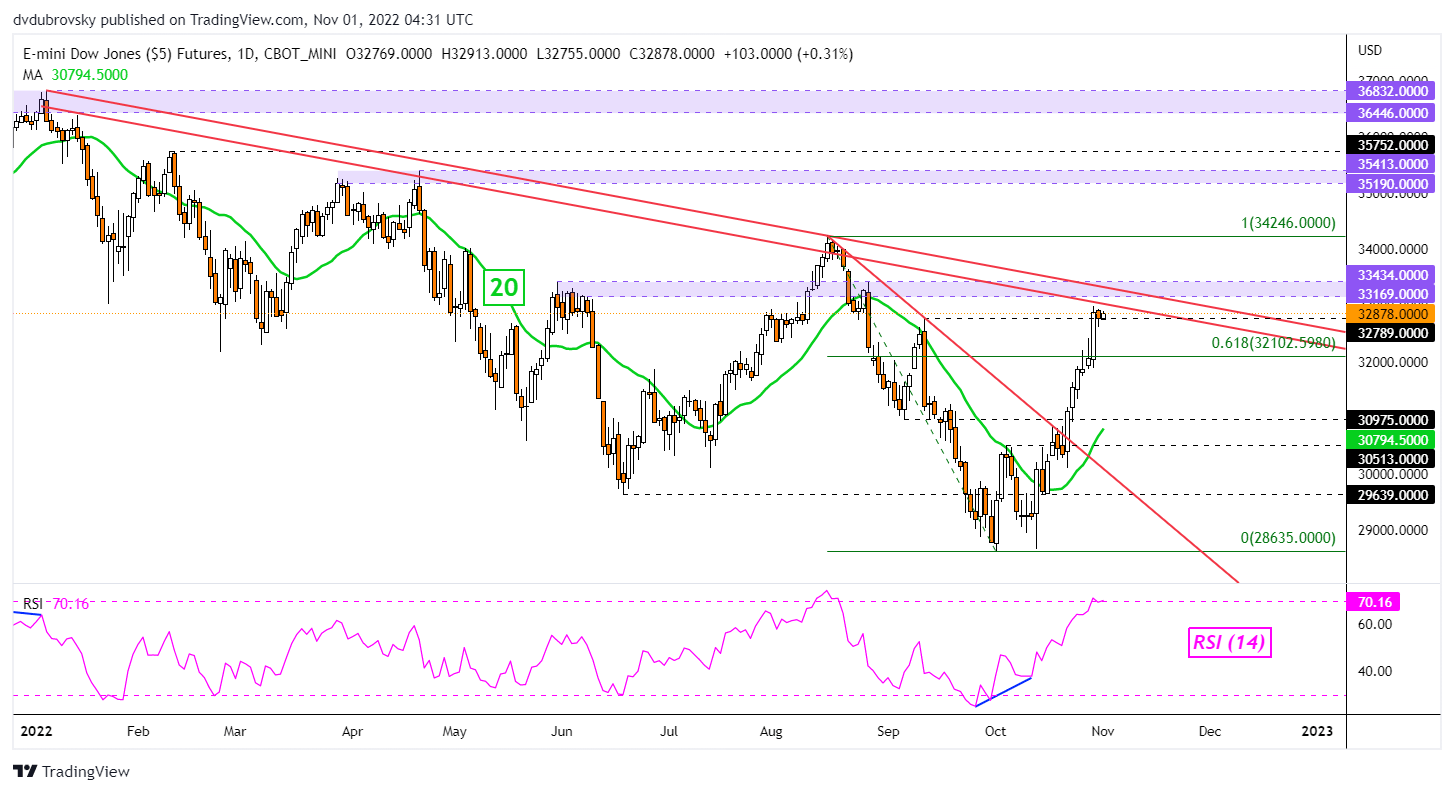
Dow Jones Technical Analysis – Daily Chart
Dow Jones futures may face a key technical test in the coming sessions. The index has rallied over 15 percent since September to retest a falling zone of resistance going back to the beginning of this year. The latter may hold, reinstating the downside bias. Also standing in the way above is the key 33169 – 33434 resistance zone.
The combination of these two technical barriers could prove to be formidable. A turn lower places the focus on the near-term 20-period Simple Moving Average (SMA). It could hold as support, maintaining a near-term upward trajectory. Otherwise, resuming losses would place the focus on the October low at 28635. Clearing resistance opens the door to face the August peak at 34246 before the 35190 – 35413 zone nears.
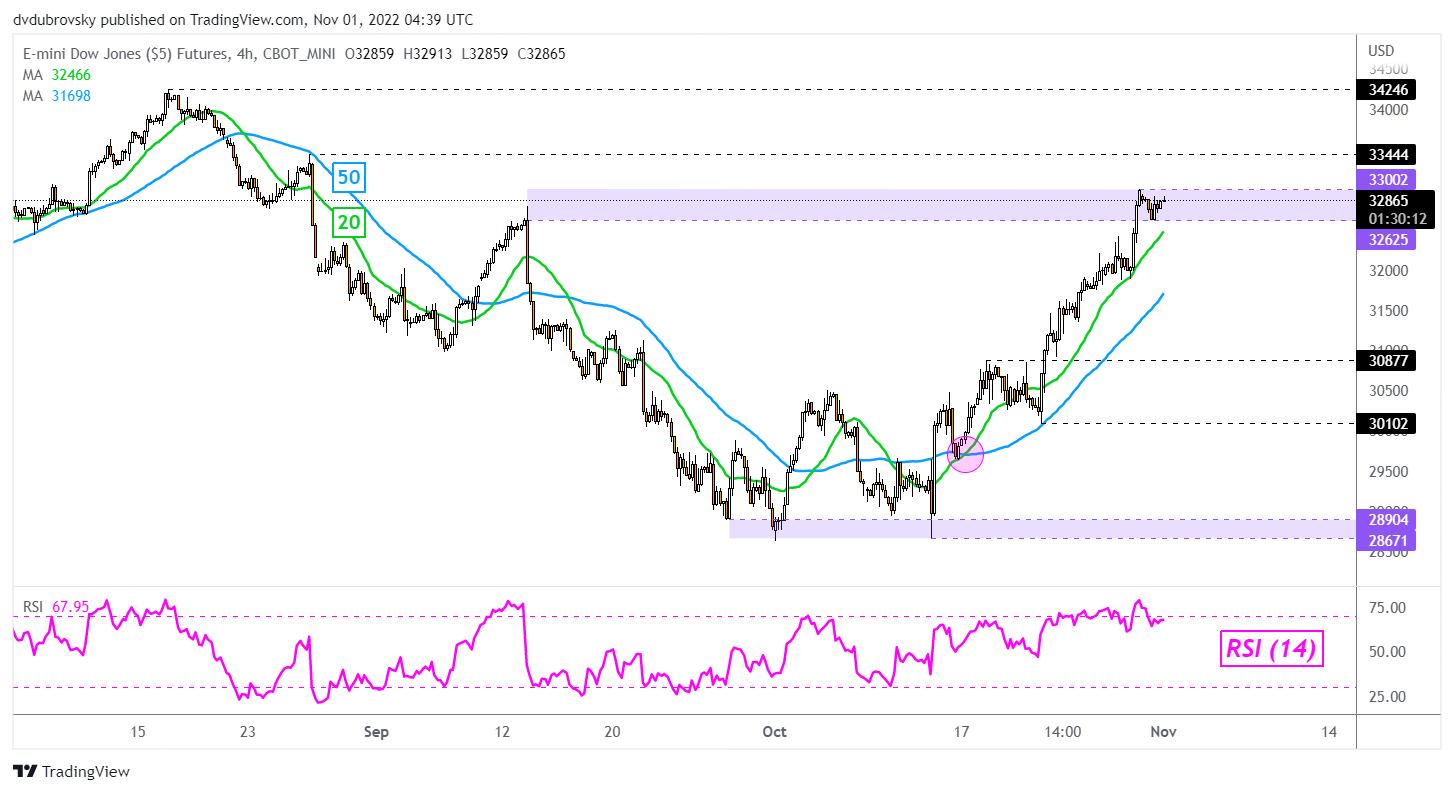
Dow Jones Technical Analysis, 4-Hour Chart
Zooming in on the 4-hour chart can give a better picture of the near-term focus. On this timeframe, the 20- and 50-period lines point upward. Clearing the 32625 – 33002 resistance zone opens the door to testing the August peak. Otherwise, confirming a breakout under the SMAs opens the door to testing 30877 followed by 30102.
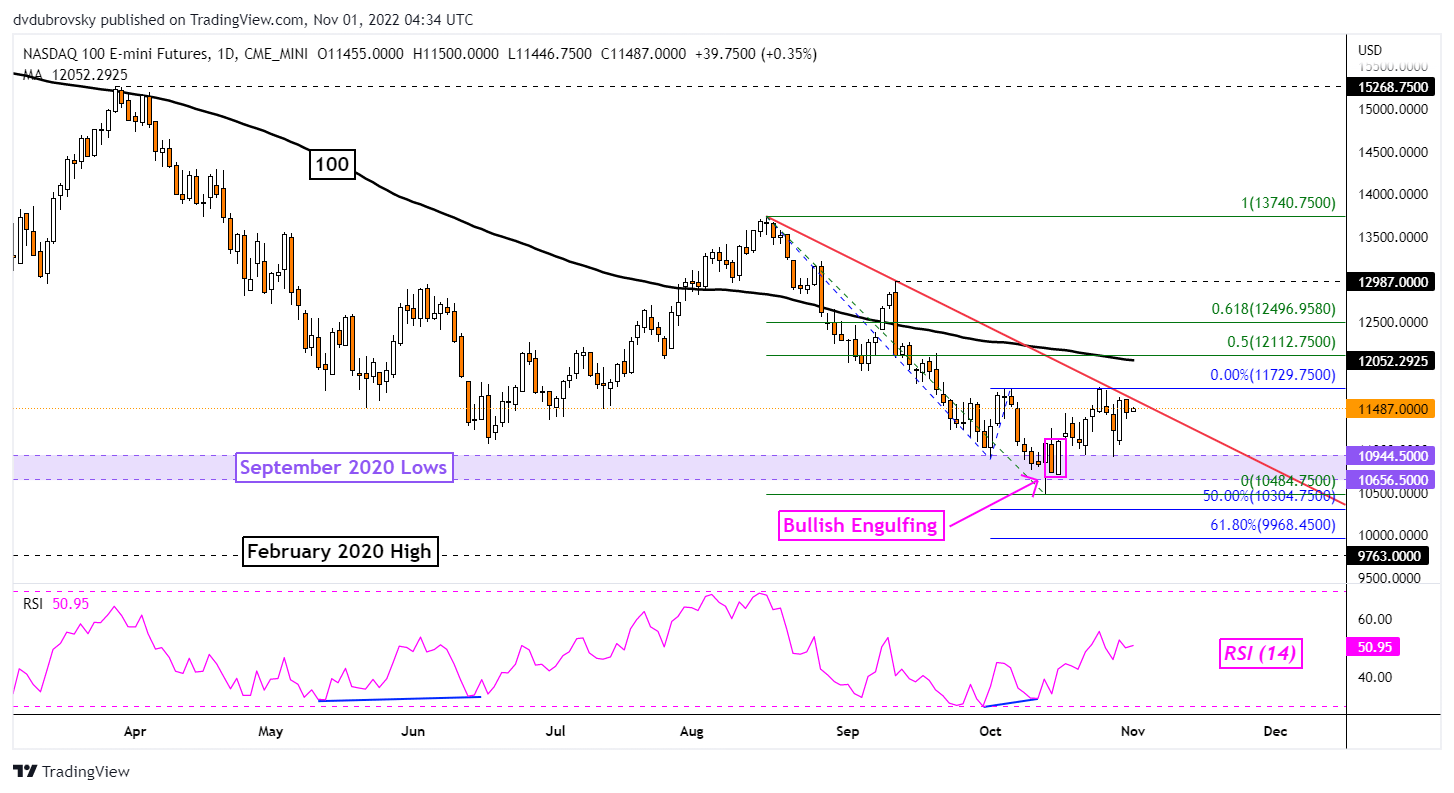
Nasdaq 100 Technical Analysis – Daily Chart
Nasdaq 100 futures have been consolidating above September 2020 lows. This followed the presence of positive RSI divergence, which showed that downside momentum was fading. A Bullish Engulfing also soon emerged, opening the door to a reversal given confirmation. The near-term falling trendline from August has also been containing prices.

Given the proximity of the Nasdaq to the latter, either a breakout or reinforcement of the trendline is likely in the cards soon. Confirming a breakout exposes the 100-day SMA. The latter could hold, reinstating the dominant downside focus. If not, prices may find themselves accelerating toward the August peak at 13740.
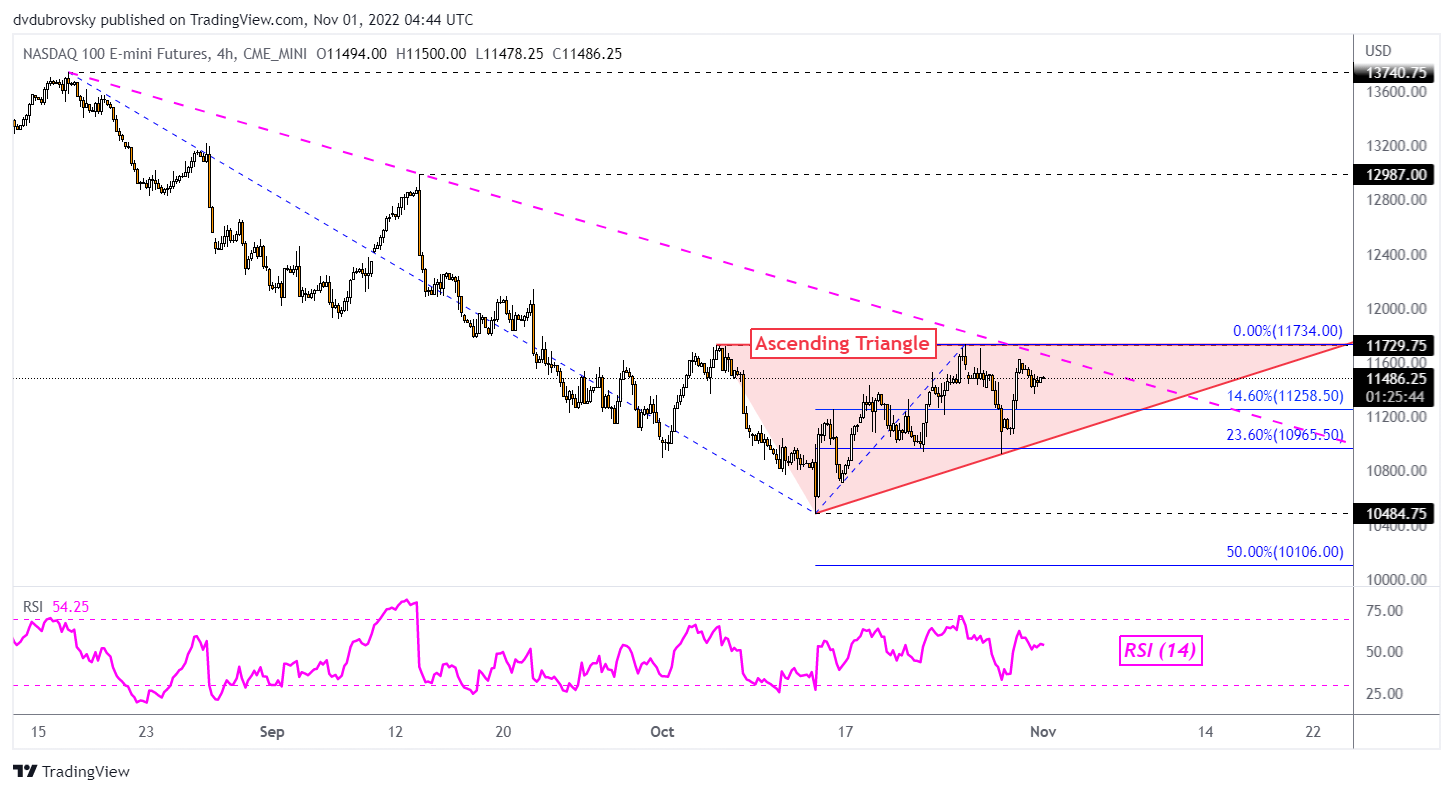
Nasdaq 100 Technical Analysis, 4-Hour Chart
Zooming in on the 4-hour chart reveals that an Ascending Triangle seems to be in the works. The ceiling seems to be at 11734, with rising support from early October making up the floor. The direction of the triangle’s breakout could be key for the coming trend. Breaking higher opens the door to reversing the downtrend since August. Otherwise, a downside breakout exposes the midpoint of the Fibonacci extension at 10106.
--- Written by Daniel Dubrovsky, Senior Strategist for DailyFX.com
To contact Daniel, follow him on Twitter:@ddubrovskyFX