Article by IG Chief Market Analyst Chris Beauchamp
Dow Jones, Nikkei 225, Hang Seng Analysis and Charts
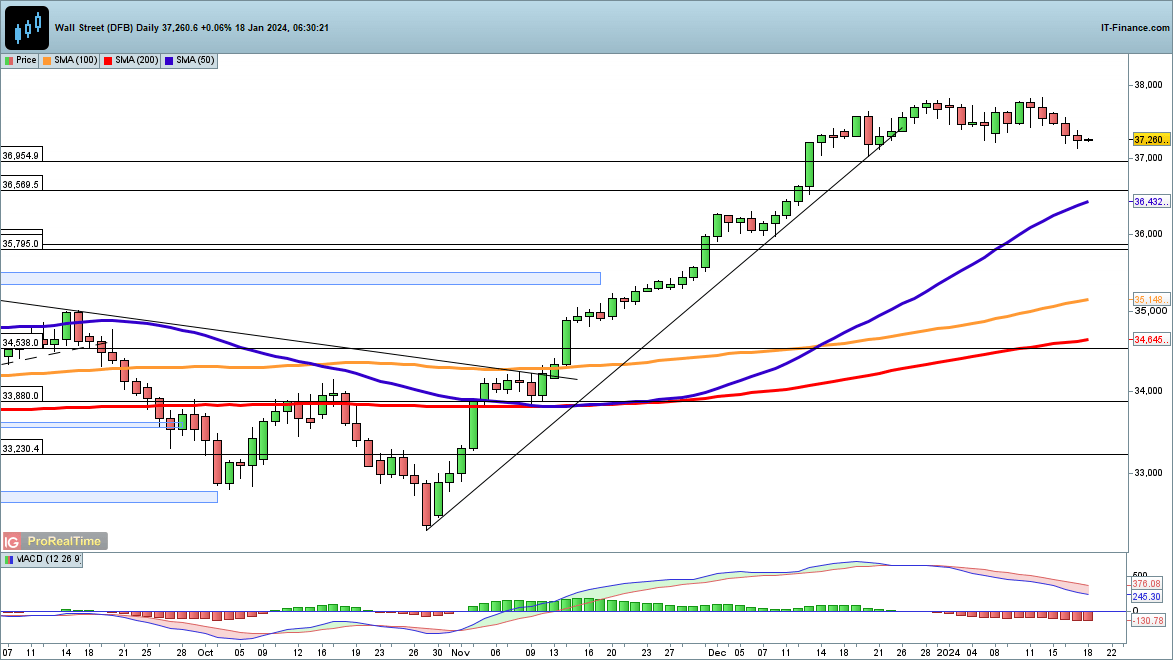
Dow continues to track lower
A gentle pullback has continued here, with the price resuming a short-term topping pattern.A deeper retracement below 37,000 could bring the 50-day SMA into view, which would take the price to its lowest level since early December.
Even this, or a deeper drop would leave the uptrend intact. Short-term support may be found at the early 2022 highs at 36,954.
Dow Jones Daily Chart
| Change in | Longs | Shorts | OI |
| Daily | -19% | 13% | -3% |
| Weekly | 14% | -16% | -6% |
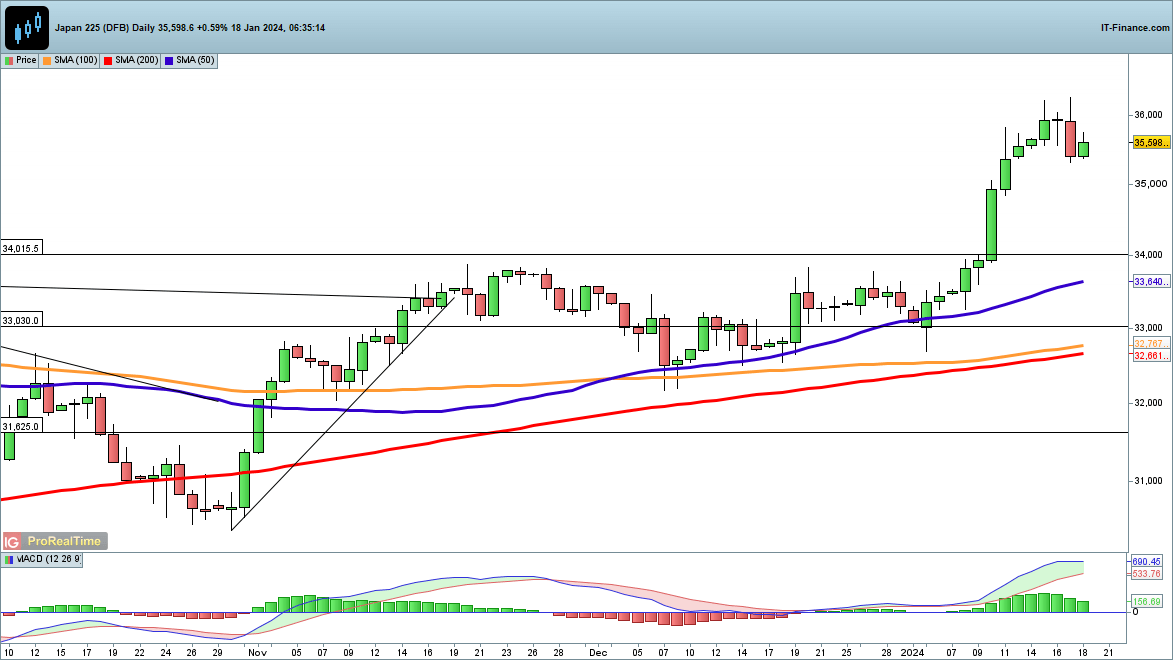
Nikkei 225 stabilizes after Wednesday's reversal
The index’s remarkable run higher stopped yesterday as the price dropped back below 36,000.The price has registered some small gains overnight and remains close to this week’s multi-decade high. A close below 35,000 might signal that a deeper retracement has begun.
In the event of a much deeper pullback, the summer highs at 34,000 come into view. A close back above 36,000 puts the buyers in charge again in the short-term.
Nikkei 225 Daily Chart

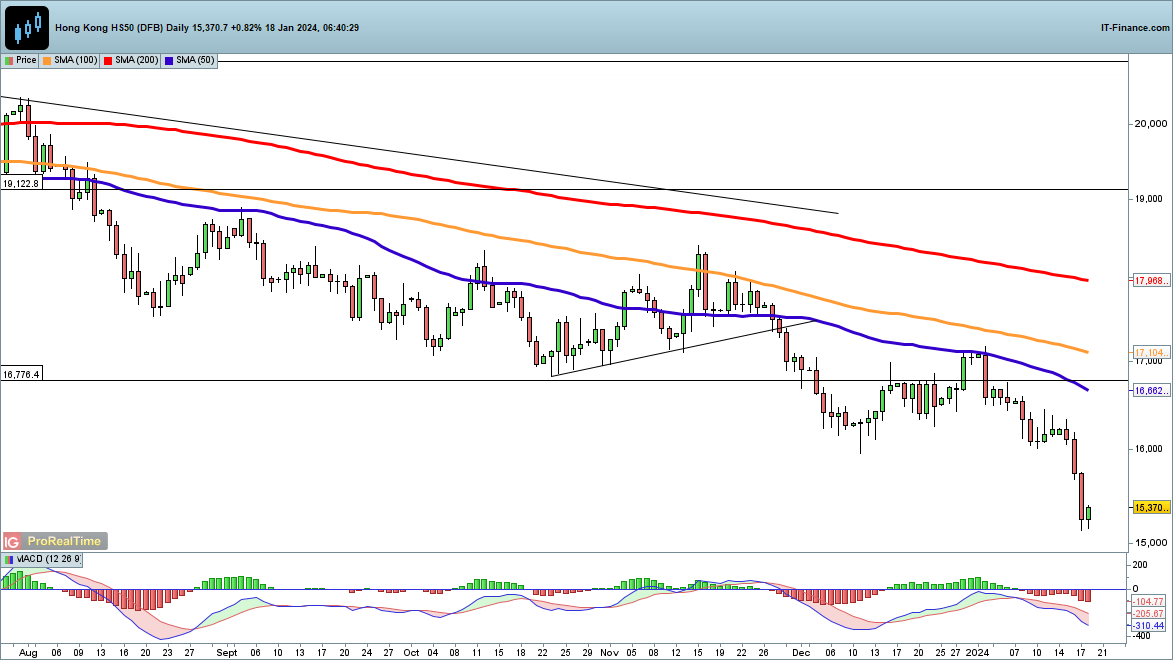
Hang Seng edges off a 14-month low
This week saw the index plummet to its lowest level since November 2022, with disappointing Chinese GDP data adding to the tough outlook for that economy.After the steep losses earlier in the week a bounce has taken place overnight, though it remains to be seen if it can muster up additional strength towards 16,000 and the previous low.
Further declines target the October 2022 low at 14,830.
Hang Seng Daily Chart