


Australian Dollar, AUD/USD, US Dollar, AUD/JPY, Japanese Yen - Talking Points
- The Australian Dollar has eased today as it falls back in the range
- AUD/USD is below 68 cents after the US Dollar broadly rallied
- AUD/JPY broke a trendline, but prior lows held their ground

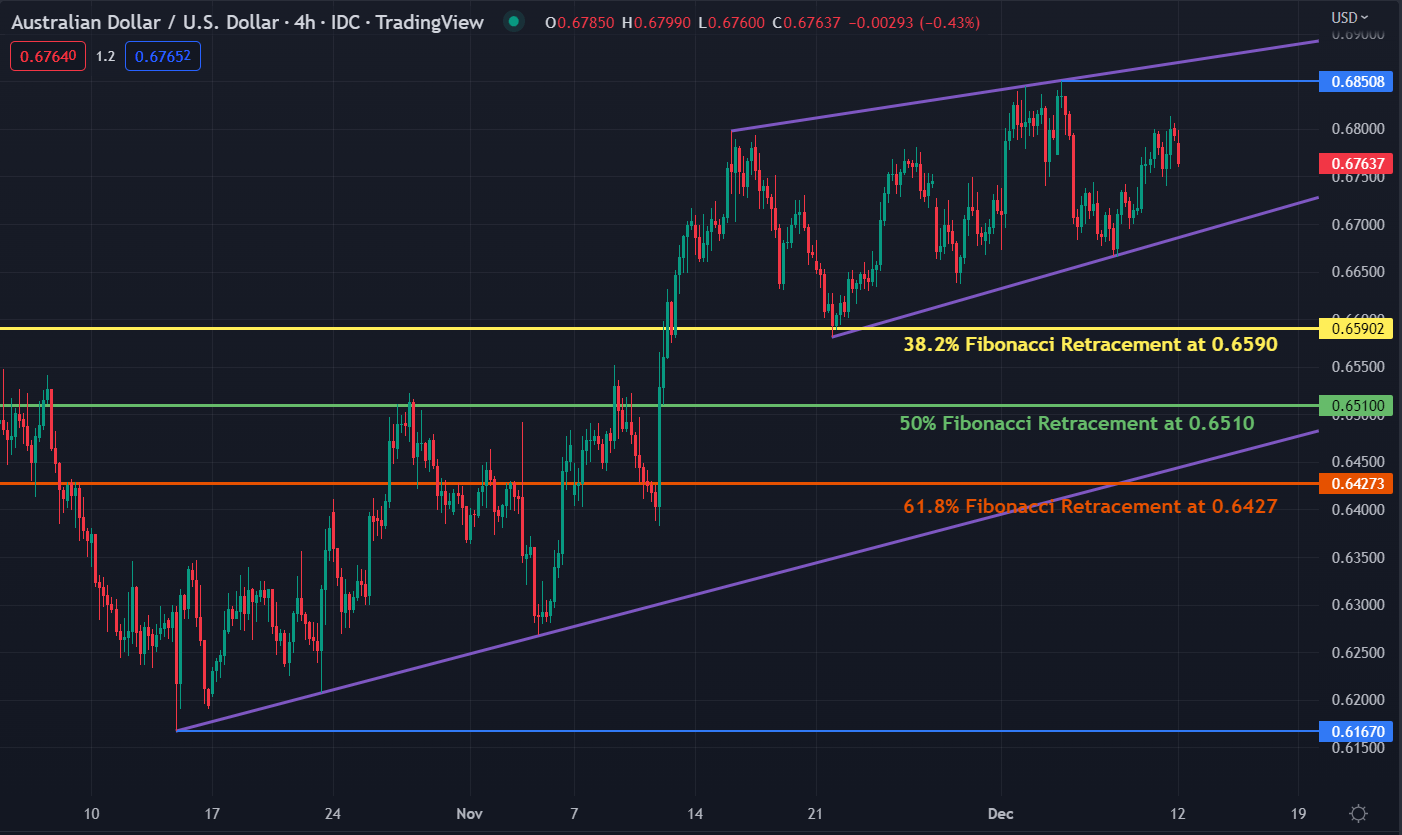
The Australian Dollar has started the week on the back foot, with the US Dollar firming across the board. Although easing on Monday, looking at the four-hour chart, the ascending trend appears to remain intact for now.
Three approximately parallel ascending trend lines speak to a similar pace of appreciation. A break below the near-term trendline, currently intersecting at 0.6690, might open up a move lower.
Support could lie at some Fibonacci Retracement levels of the move from the October low of 0.6167 to this month’s peak of 0.6851. The 38.2% retracement is 0.6590, the 50% is at 0.6510 and the 61.8% pullback is at 0.6427.
AUD/USD 4-HOUR CHART
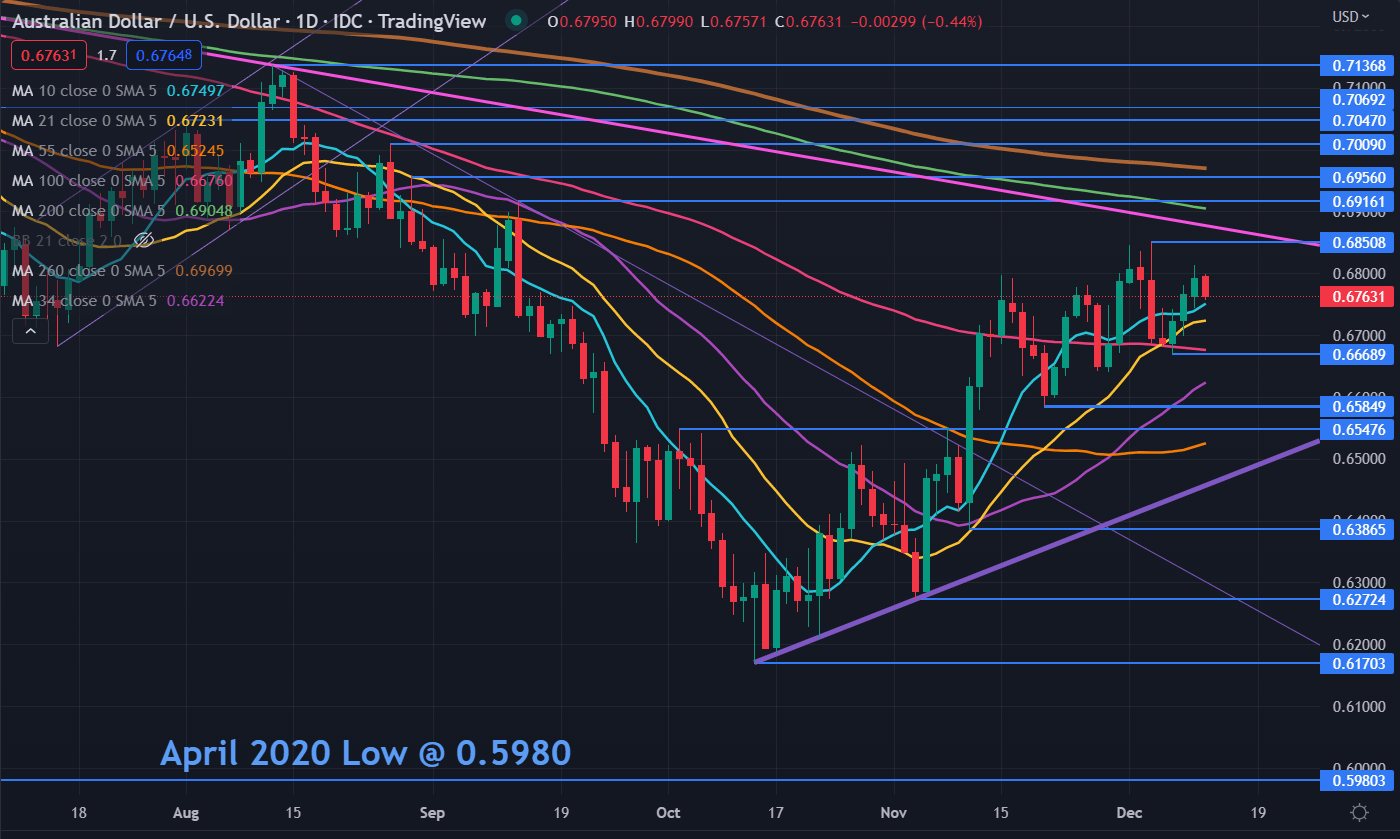
Zooming out to the daily chart, AUD/USD has been in a wide 0.6550 – 0.6850 range for a month. Momentum indicators seem to agree with a range-type environment, with mixed signals emerging from the set-up of several Simple Moving Average (SMA).
The price is above all tenors from 10- to 100-days but below the 200- and 260-day SMAs. This may suggest that short- and medium-term bullish momentum could unfold but the long-term setup remains a headwind for now.
The prior peaks of 0.6916 and 0.6956 are also near the 200- and 260-day SMAs respectively and these levels might offer resistance. Below them, the recent high of 0.6851 could offer resistance as it also has a descending trendline closing in on it.
On the downside, support may lie at the previous lows of 0.6669, 0.6585, 0.6387, 0.6272 or 0.6170. A breakpoint at 0.6548 is also a potential support level.
An ascending trendline might provide support, currently intersecting at 0.6460.
AUD/JPY
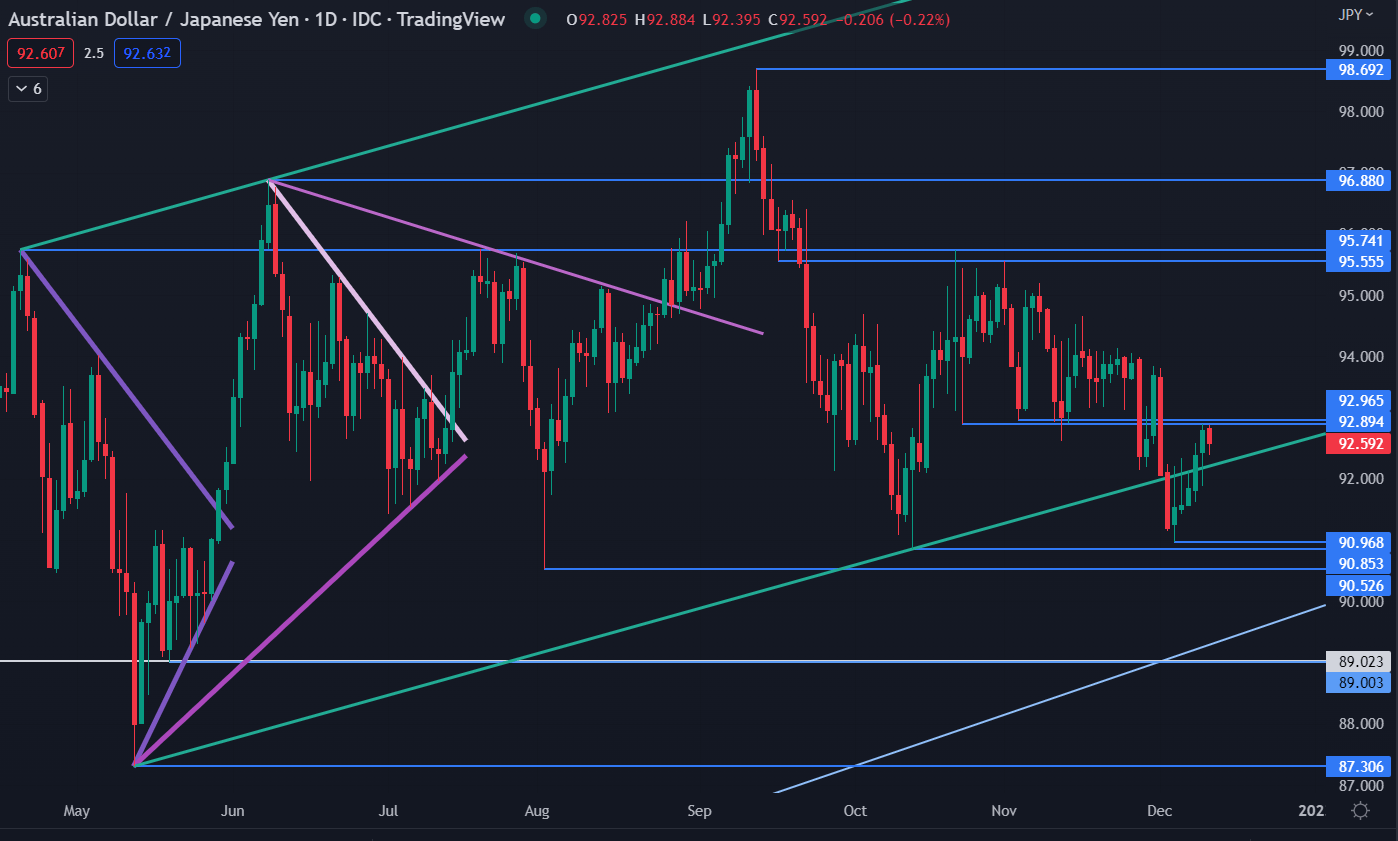
AUD/JPY remains in a wide 90.85 – 95.74 range that it has been in for almost 3 months.
The price tried to have a look lower at the start of the month but was unable to break below the prior lows of 90.85 and 90.53 and these levels may continue to provide support.
That move went below an ascending trend line that had been in play for a few months and might add weight to the perspective that AUD/JPY could be in range for now.
The high seen on Friday and so far on Monday was unable to overcome breakpoint resistance at 92.89 and 92.97 and these levels may continue to offer resistance.
Further up, the peak of 95.56 coincides with a break point that could continue to offer resistance ahead of the previous high of 95.74.

AUD/JPY CHART
--- Written by Daniel McCarthy, Strategist for DailyFX.com
To contact Daniel, use the comments section below or @DanMcCathyFX on Twitter


