


Australian Dollar, AUD/USD, Technical Analysis, Retail Trader Positioning – IGCS Update
- Australian Dollar cautiously climbing in recent days
- Retail traders have been slowly boosting bearish bets
- Is this a sign that AUD/USD may continue higher next?

The Australian Dollar has been pushing cautiously higher in recent days. In response, retail traders have been slowly increasing downside exposure in AUD/USD. This can be seen by taking a look at IG Client Sentiment (IGCS), which often functions as a contrarian indicator. With that in mind, could further gains be in store for the exchange rate?
AUD/USD Sentiment Outlook – Bullish
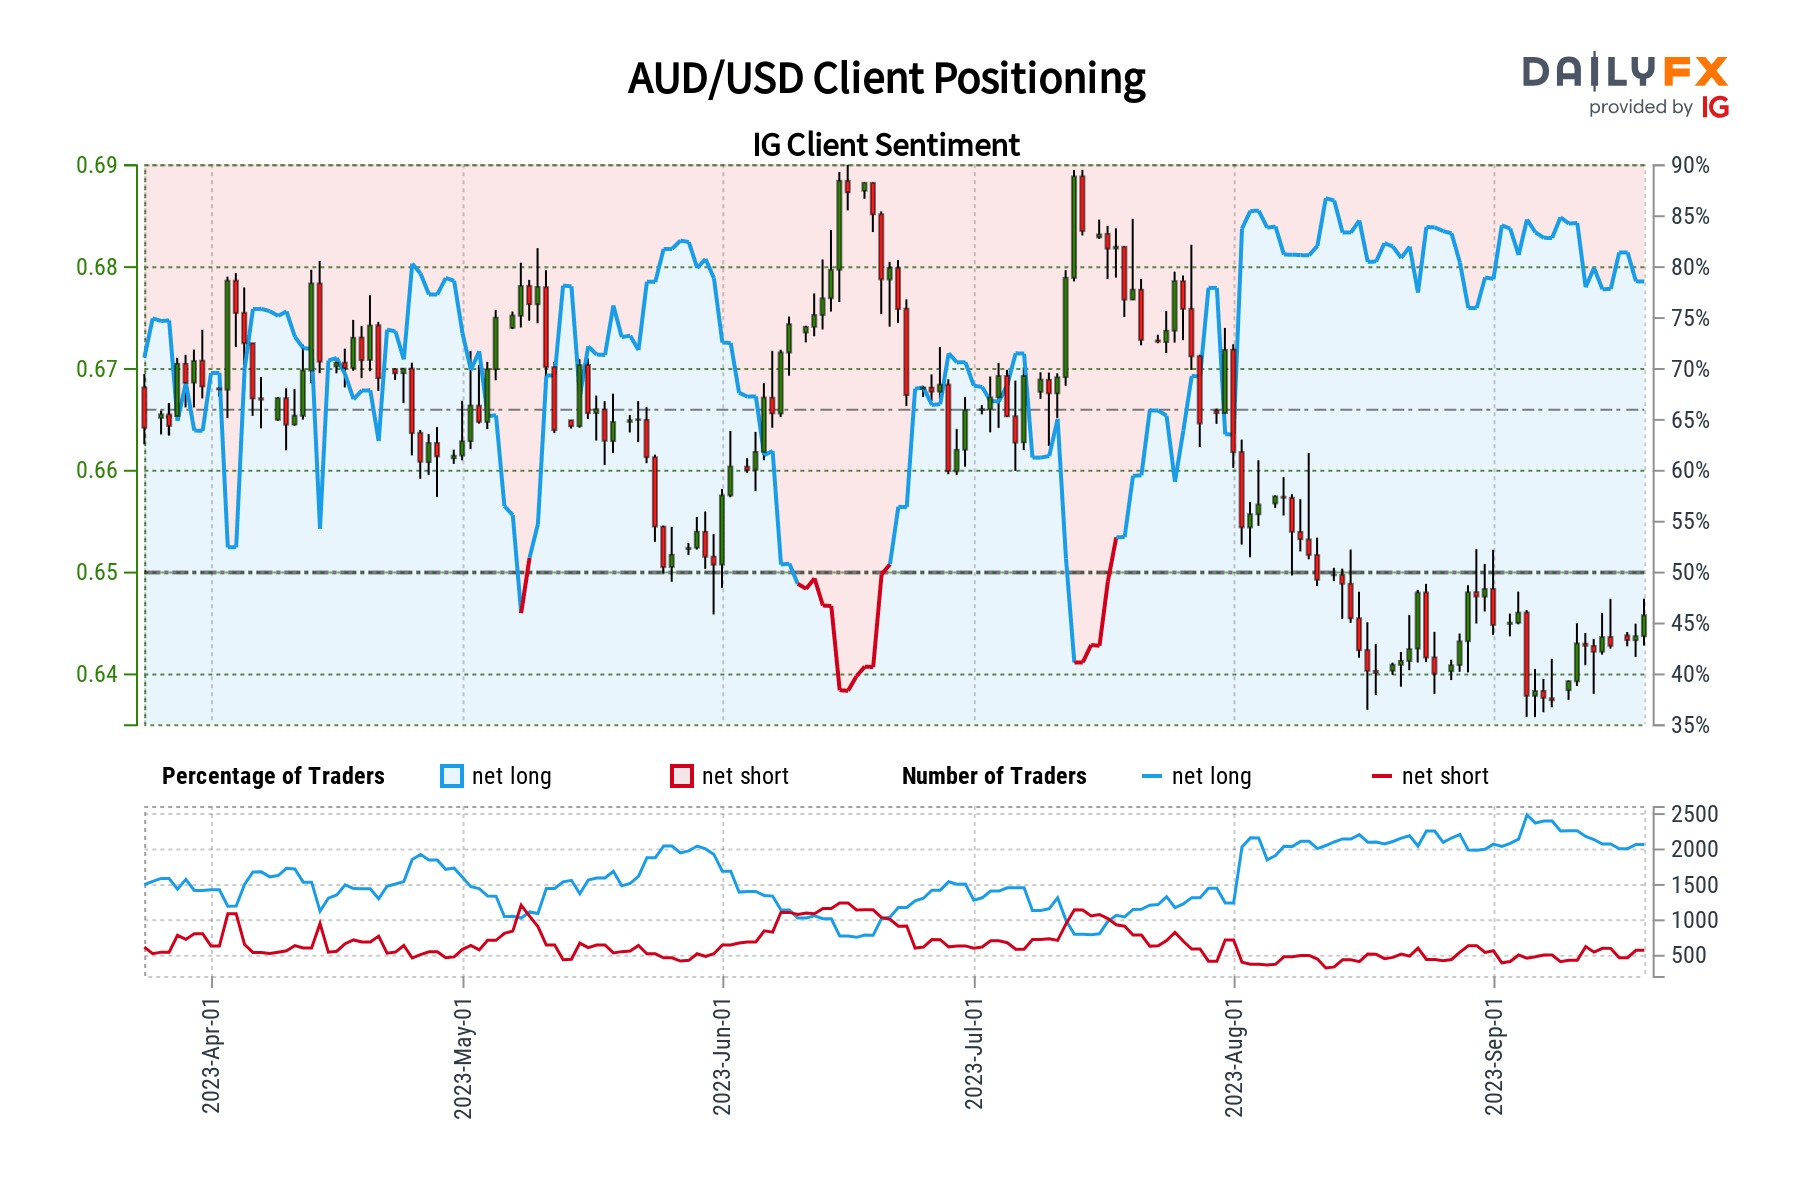
The IGCS gauge shows that about 74% of retail traders are net-long AUD/USD. Since most of them are still biased to the upside, this hints that prices may continue falling down the road. That said, downside exposure has increased by 21.6% and 13.5% compared to yesterday and last week, respectively. With that in mind, recent changes in positioning hint that the price trend may soon reverse higher.
Australian Dollar Daily Chart
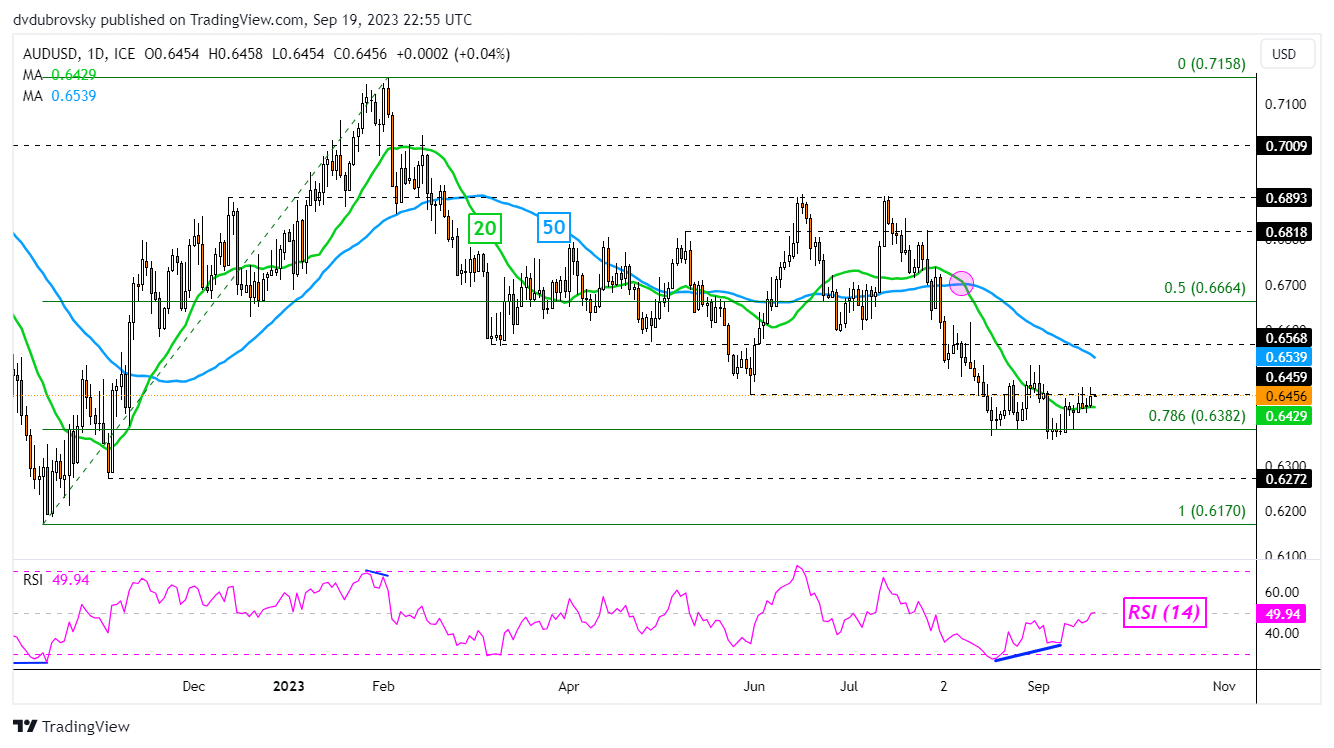
Looking at the daily chart below, the Australian Dollar has closed above the 20-day Moving Average. This followed the emergence of positive RSI divergence, a sign of fading downside momentum. The latter can at times precede a turn higher. Now, the focus is on the 0.6459 inflection point as immediate resistance, followed by the 50-day Moving Average.
The latter may hold as resistance, maintaining the broader downside technical bias. Otherwise, further gains would subsequently place the focus on the 0.6568 inflection point. In the event of a turn lower, clearing support at 0.6382 (78.6% level) exposes the November low of 0.6272 before the October 2022 bottom of 0.6170 kicks in.

--- Written by Daniel Dubrovsky, Senior Strategist for DailyFX.com


