To receive Tyler’s analysis directly via email, please sign up here.
Talking Points:
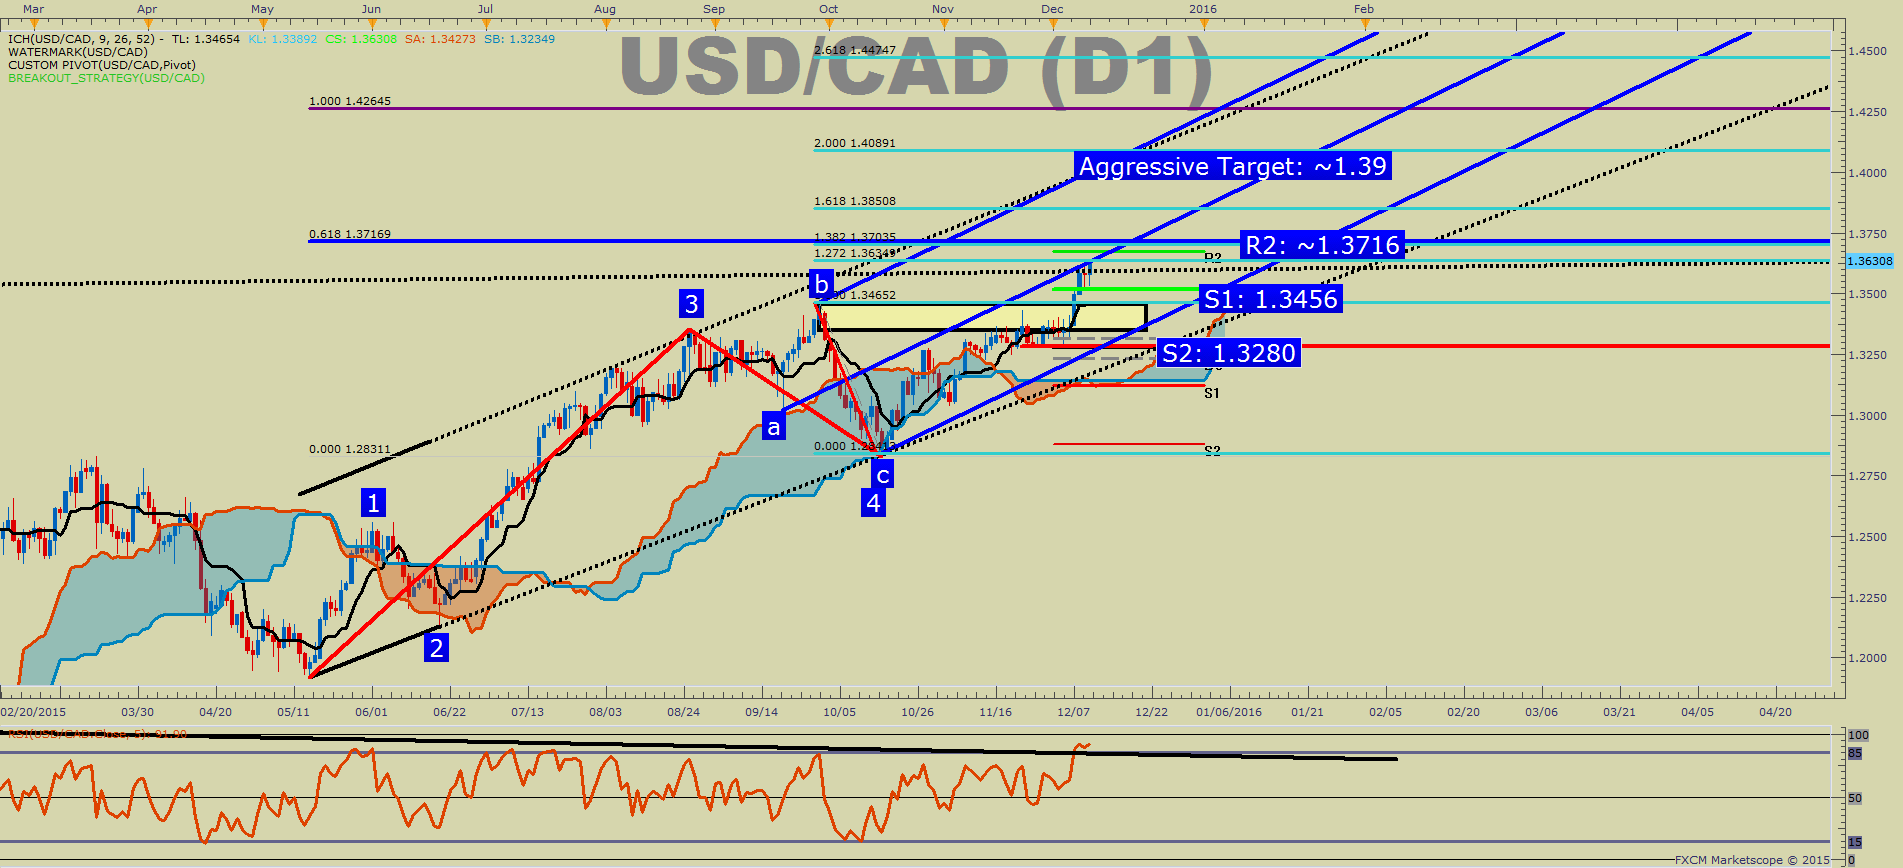
-USD/CAD Technical Strategy: Stay With Trend Above 1.3456
-USD/CAD Has Been Pushed Higher As WTI Crude Oil Prints 6-Year Lows
- Trader Sentiment Shows CAD Bulls May Well Remain Disappointed
USD/CAD punched higher to new 11-year highs and looks poised to close in on the 2004 high of 1.3908. There is a lot of doubt surrounding the US Dollar going into December 16, the date the Federal Reserve is presumed to announce a rate hike and lay out the requirements for subsequent hikes. Though it may appear tempting to sell USD/CAD at 11-year highs in hopes of catching a retracement at the turn, please note that there is a handful of factors working against the CAD right now. First, the CAD is quickly becoming the short du jour because of the CAD’s correlation to Oil. The current 3-month correlation of USDCAD to US Oil is -0.83, which is highly significant. In addition, to energy’s direction pushing USDCAD higher, the recent leg higher in USD/CAD has happened alongside a seasonally weak US Dollar in December. Should the US Dollar strengthen on upcoming event risk around the expected Fed rate increase, we could hit upside targets in a hurry.
Levels:
Through much of November, we discussed the importance of the extreme day price range of USD/CAD on September 29 of 1.3346-1.3456. That 90-pip range acted as strong resistance until December 7th. December 7th was the same day US Oil broke below the August 24th low (see correlation above). Since then, USDCAD has continued to move higher, and the momentum isn’t slowing down. This acceleration higher in USDCAD is happening as US dollar is working lower in a corrective channel toward the 100-day moving average at 12,140. Utilizing the September high as new support, we can remain patient to look to either buy dips or hold off on trying to 'sell-the-top' as price could extend past the 2004 high of 1.3900 if Oil doesn't turn.
To Learn What FXCM’s Most Successful Traders Do on a Consistent Basis, sign up for our free guide here.
Trade:
USD/CAD looks poised to move higher as Oil sits around 6.5-year lows and USDCAD spot trades above the late September high. Most targets for swing trades on USD/CAD cluster between 1.37/39, which aligns with the channel below. Should we break below the prior extreme day price range, we could credibly start to look for an aggressive breakdown to the prior key support of 1.3280 where we based before the current run higher. Lastly , Trader sentiment continues to show traders fighting this very strong trend without any data (read: support breaks) to validate the high-risk move. If these levels continue to hold, it’s hard not to prefer US Dollar higher toward eventual new multi-year highs.