


To receive James Stanley’s analysis directly via email, please SIGN UP HERE
Talking Points:
- GBP/USD Technical Strategy: Flat, short setup identified
- A strong UK Employment report last week has brought price on GBP/USD back into resistance.
- The near-term setup is to the short-side, and those with a bullish stance can wait for a break of 1.5500 before looking to get long.
In our last article, we looked at a resistance reaction off of a confluent zone in GBP/USD. As we mentioned, this brisk reaction to resistance brought prices down to support, which opened the door for mean-reversion strategies in GBP/USD; and only a day later a robust employment report out of the UK sent prices shooting higher on the Sterling. This better-than-expected employment print combined with a very weak US Dollar has helped to bring GBP/USD to new near-term highs, and four consecutive trading days’ worth of resistance at the 1.5485-1.5515 area could open the door for additional range-plays.
On the short-side, a projected trend-line connecting the high from August 25th to the high of September 18th projects to current period resistance (shown in red on the below chart). This could offer a confluent zone of resistance as the 1.5500 level is also a major psychological level, while also offering numerous price action swing-highs. Traders could look to sell off of the 1.5500 resistance area with targets cast towards previous levels-of-interest at 1.5345 (50% Fibonacci retracement of the ‘secondary move’ from the Financial Collapse low to the 2014 high), 1.5308 (23.6% of the ‘big picture’ move, taking the 2007 high to the Financial Collapse low), and then 1.5250 (major psychological level).
Alternatively, traders looking to initiate long positions can wait for price to break above the projected trend-line (and above this 1.5500 zone of resistance) before looking to trigger long. Should 1.5500 give way, traders can wait for support to develop near old resistance, and can look to assimilate targets at 1.5567 (38.2% of the most recent major move, taking the 2014 high to the 2015 low), 1.5750 (major psychological level), and 1.5781 (38.2% Fibonacci retracement of the secondary move).
(click below for larger image)
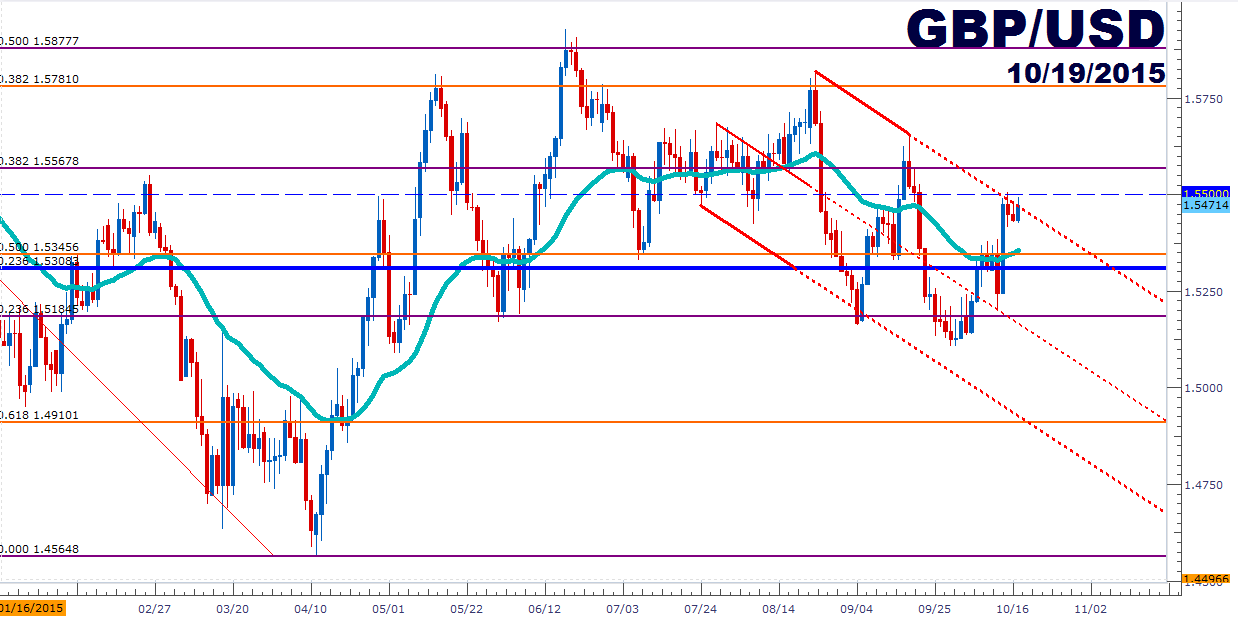
Created with Marketscope/Trading Station II; prepared by James Stanley
--- Written by James Stanley, Analyst for DailyFX.com
To receive James Stanley’s analysis directly via email, please SIGN UP HERE
Contact and follow James on Twitter: @JStanleyFX


