


-- Subscribe to Jamie Saettele's distribution list in order to receive a free report to your inbox several times a week.
--For more analysis and trade setups (including current positions and the ‘watchlist’, visit SB Trade Desk
Weekly
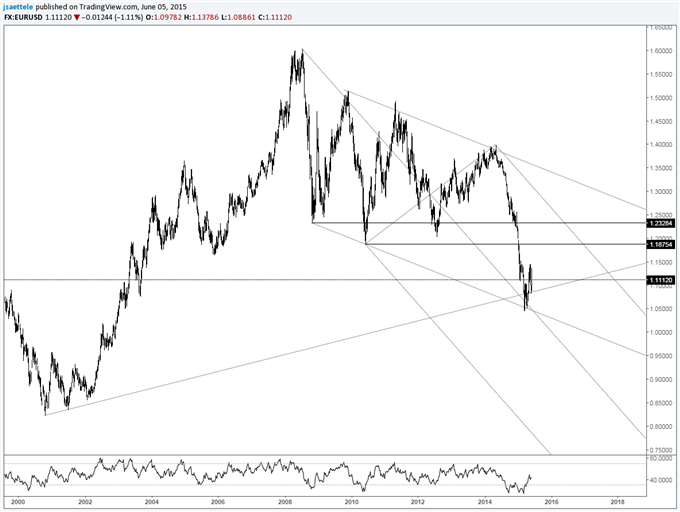
Chart Prepared by Jamie Saettele, CMT
Automate trades with Mirror Trader
-“Several longer term technical observations are worthy of note; the rate found low at an important long term level (line off of 2008 and 2010 lows) and the ownership profile (as per COT) is at a record. The speculative crowd has never been more bearish…ever. Such conditions typically precede important reversals…although not necessarily right away. A break above the resistance lines (old support) would indicate that behavior has significantly changed and open up a run on 1.13.”
-EURUSD has responded well to a long term slope confluence. Focus is higher towards at least 1.18 as long as price is above the May low.
Weekly

Chart Prepared by Jamie Saettele, CMT
Automate trades with Mirror Trader
-“Keep the 50% decline from the 2014 high / Oct low at 1.5874/78 in mind for a top if reached. Weakness below 1.5390 would open up 1.5190 and 1.5090.”
-GBPUSD ended up finding top at 1.5814 in May. The decline found support near the mentioned 1.5190. The failure at slope resistance raises the specter of continued long term weakness. If a larger decline is underway then expect to see resistance from 1.5490 to 1.5570.
Weekly
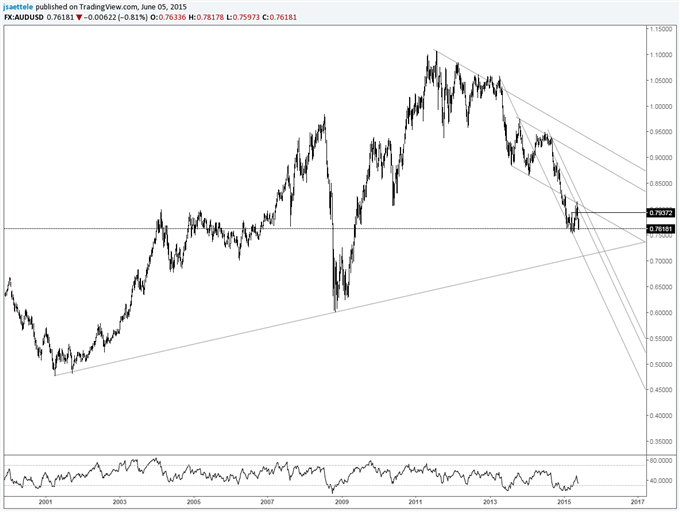
Chart Prepared by Jamie Saettele, CMT
Automate trades with Mirror Trader
-“A broadening bottom pattern yields an objective of .8342 (just above the Jan high at .8294) but AUDUSD has met the line that extends off of the Aug 2013 and Jan 2014 lows (former support).”
-The mentioned line pinpointed the high and AUDUSD is approaching trend lows. The next support area is probably the trendline that extends off of the 2001 and 2008 lows (7 year cycle lows?) near .7100 through most of June. Exceeding .7818 would suggest that additional sideways is in order and delay the next bear leg.
NZD/USD
Weekly

Chart Prepared by Jamie Saettele, CMT
Automate trades with Mirror Trader
-“One can’t help but notice that an epic double top is possible with a target of .5898. That would trigger on a drop below .7370.”
-“A bearish wedge pattern has formed and yields an objective of .6607.” Above .7200 would AT LEAST delay bear trend resumption and potentially indicate that a major low has formed at long term pitchfork support.
USD/JPY
Weekly

Chart Prepared by Jamie Saettele, CMT
Automate trades with Mirror Trader
-“A USDJPY breakout from the 6 month coil would open up 123.16-124.13 (high close from June 2007 and 2007 high). A measured objective from the pattern yields 128.12.”
-Focus remains on 128.12 as USDJPY is trading at 13 year highs (exactly). Another level to be aware of is the 1997 high at 127.50. Weakness below 123.60 is needed in order to indicate a behavior change.
Weekly

Chart Prepared by Jamie Saettele, CMT
Automate trades with Mirror Trader
-“USDCAD has turned up from just below 1.1931 (low was 1.1919). The break above the median line opens up a run on former support from 1.2350 to 1.2447.”
-USDCAD traded into the reversal week close (from March) at 1.2558 before coming off. A broader range may in store. In fact, weekly RSI recorded its 2nd highest reading ever in Jan (only higher reading was in 1984). Other high periods led to extended periods of sideways trading. The failed run at a high volume level (1.2560) twice this week warns of additional range trading.
Weekly

Chart Prepared by Jamie Saettele, CMT
Automate trades with Mirror Trader
-USDCHF is trading at just about the exact midpoint of the year’s range. A dotwntrend has been underway since the rate failed at 9 year trendline resistance in March but price needs to remain beneath .9542 in order for that downtrend to remain in place. The next level of concern for support would probably be the 2012 low at .8930.


