


-- Subscribe to Jamie Saettele's distribution list in order to receive a free report to your inbox thrice a week.
Weekly
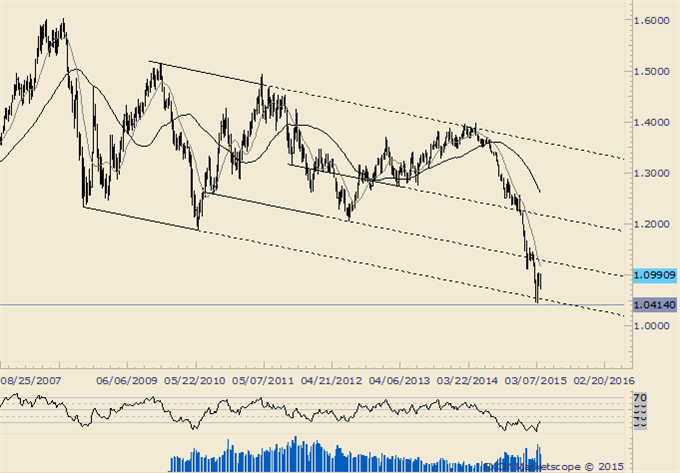
Chart Prepared by Jamie Saettele, CMT using Marketscope 2.0
Automate trades with Mirror Trader
-“There is a long term level to be aware of. The line that extends off of the 2008 and 2010 lows is at about 1.0545 this week. The March 2003 low is at 1.0499.”
-“EURUSD finished the week above 1.08, indicating potential for a period of sideways trading in the coming months. The first important resistance stems from former slope support just below 1.13 over the next several weeks.”
-EURUSD is nearing the first 20 day high (1.1052) since 7/1/2014. In fact, it’s been 196 days since the last 20 day high. A new 20 day high would signal a major behavior change in EURUSD (from down to sideways).
Weekly
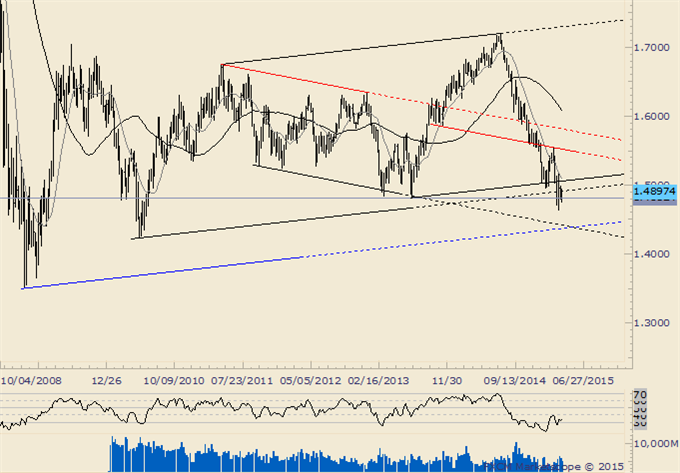
Chart Prepared by Jamie Saettele, CMT using Marketscope 2.0
Automate trades with Mirror Trader
-“A breakdown towards 1.4250-1.4350 may be underway.” The weekly reversal casts doubt on the call for 1.4350. Slope resistance that caught the February high near 1.55 could act as a magnet now. Daily and weekly divergence with momentum at price lows indicate the possibility for a turn higher.
Weekly
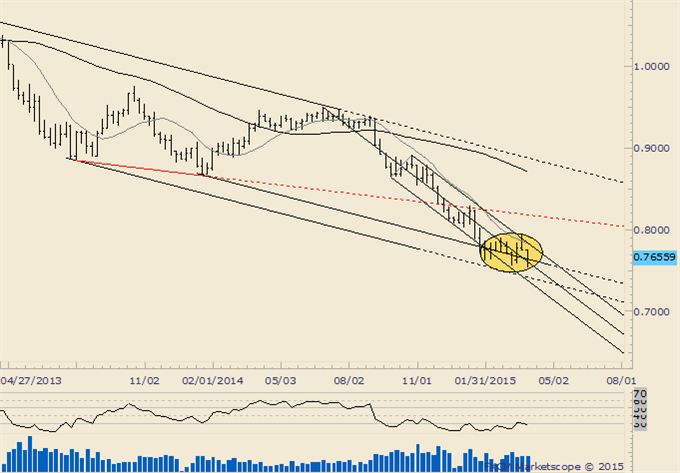
Chart Prepared by Jamie Saettele, CMT using Marketscope 2.0
Automate trades with Mirror Trader
-AUDUSD continues to trade between well-defined slope lines but beware of a possible broadening bottom (very difficult pattern to trade).
-Trade outside of the bearish upper parallel that has contained strength since late October would shift focus to a former support line (turned resistance in January) near .8180.
Weekly
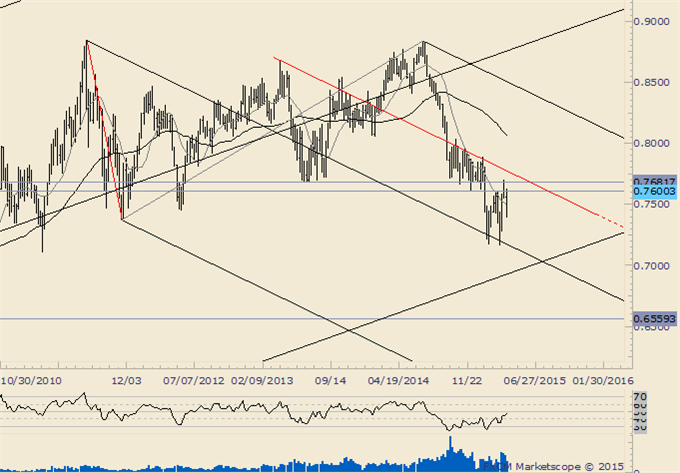
Chart Prepared by Jamie Saettele, CMT using Marketscope 2.0
Automate trades with Mirror Trader
-“NZDUSD traded to the 61.8% retracement of its 3 year range today (.7929) and the next level of interest probably isn’t until the 2013 Labor Day gap at .7722. One can’t help but notice that an epic double top is possible with a target of .5898. That would trigger on a drop below .7370.”
-If the major double top is going to prove successful, then the February high needs to remain in place. Risk of a double bottom has emerged that would yield an objective of .8038 although Kiwi would probably face pressure from longer term slope resistance near .7750.
USD/JPY
Weekly
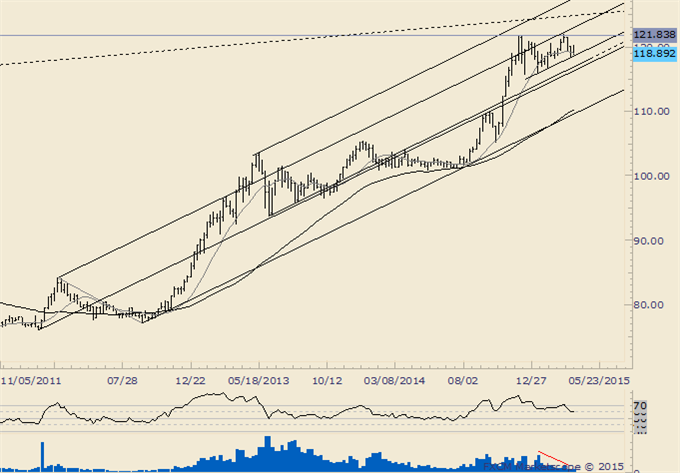
Chart Prepared by Jamie Saettele, CMT using Marketscope 2.0
Automate trades with Mirror Trader
-“Continue to favor a broad range as 119.80-120.70 as resistance and 116.40-117.10 as support. A move through either one of these zones would define target zones of 124-128 and 110-114.”
-“The lack of volume on strength since January warns that all is not well with the USDJPY uptrend.” The next support level is probably 116.50.
USD/CAD
Weekly
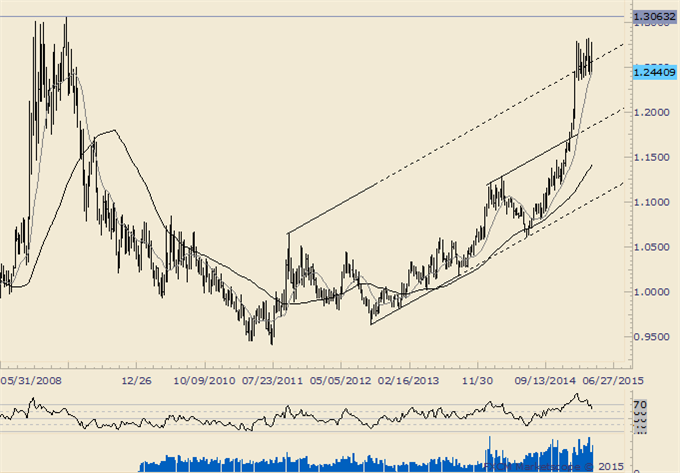
Chart Prepared by Jamie Saettele, CMT using Marketscope 2.0
Automate trades with Mirror Trader
-“The contracting range indicates potential for a triangle from the high. Typically, a triangle will lead to a thrust in the direction of the preceding trend. The slight new high satisfies minimum requirements for a triangle thrust. USDCAD risks a return to 1.19 (old resistance line).”
Weekly
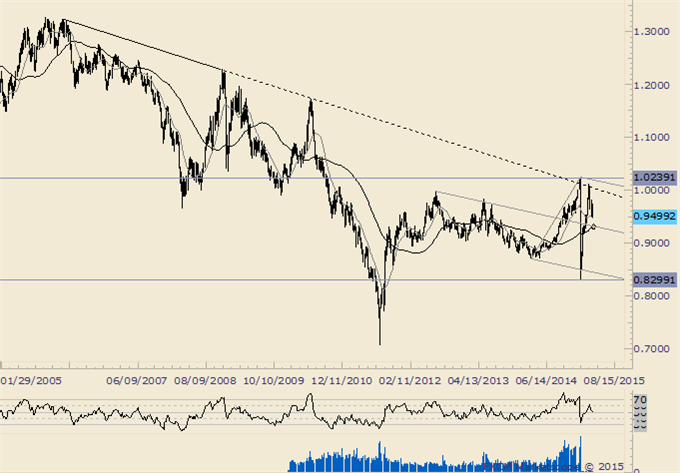
Chart Prepared by Jamie Saettele, CMT using Marketscope 2.0
Automate trades with Mirror Trader
-USDCHF has reversed from 9 year trendline resistance. Focus is on the median line (about .9300) that extends off of the 2012 high. This line crosses through highs in 2013 and the October 2014 low. The 52 week MA is near this line as well.


