


Talking Points:
- US Dollar in Consolidation Mode Near Monthly Bottom
- S&P 500 Sinks as Expected, Threatens 5-Month Support
- Gold Inching to $1200, Crude Oil Recovery Accelerates
Can’t access the Dow Jones FXCM US Dollar Index? Try the USD basket on Mirror Trader. **
US DOLLAR TECHNICAL ANALYSIS – Prices turned lower as expected, with prices digesting losses near monthly lows. A daily close below the 11854-78 area (March 2009 high, 14.6% Fibonacci expansion) exposes the 11679-737 region (February 26 low, 38.2% Fib retracement). Alternatively, a reversal back above the 23.6% level at 11965 clears the way for a test of the 12107-49 zone (38.2% expansion, March 13 high).
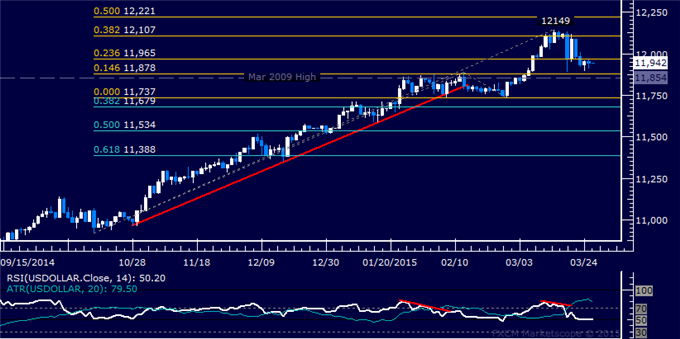
Daily Chart - Created Using FXCM Marketscope
** The Dow Jones FXCM US Dollar Index and the Mirror Trader USD basket are not the same product.
S&P 500 TECHNICAL ANALYSIS – Prices declined as expected after putting in a bearish Evening Star candlestick pattern below February’s swing high. A daily close belowrising trend line support at 2057.10 exposes the March 12 low at 2040.10. Alternatively, a reversal above the 14.6% Fibonacci expansion at 2084.00 targets the 2111.00-19.40 area (23.6% level, February 25 high).
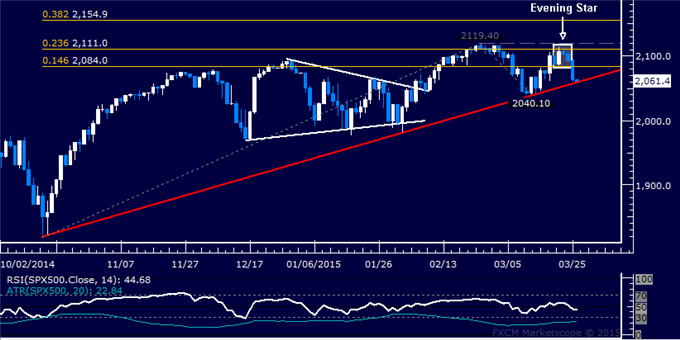
Daily Chart - Created Using FXCM Marketscope
GOLD TECHNICAL ANALYSIS – Prices look poised for another move above the $1200/oz figure. A break above the 38.2% Fibonacci retracement at 1205.58 exposes the 50% level at 1225.04. Alternatively, a turn below the 23.6% Fib at 1181.51 targets the 1166.67-1170.09 area (channel top resistance-turned-support, 14.6% retracement).
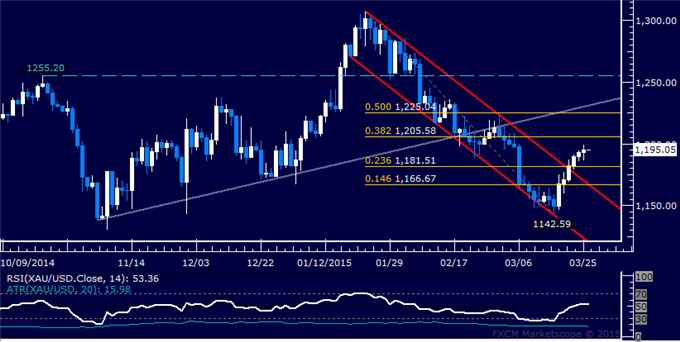
Daily Chart - Created Using FXCM Marketscope
CRUDE OIL TECHNICAL ANALYSIS – Prices are attempting to break higher out of the consolidation range carved out over the past 2 weeks. A daily close above support-turned-resistance at 58.17 exposes the 38.2% Fibonacci expansion at 59.35. Alternatively, a reversal back below the 23.6% level at 56.75 targets the March 17 lowat 52.55.
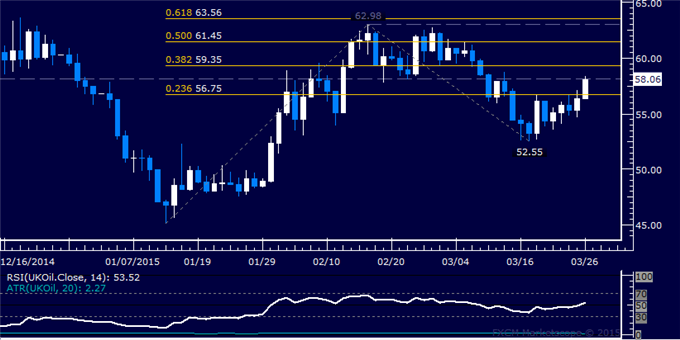
Daily Chart - Created Using FXCM Marketscope
--- Written by Ilya Spivak, Currency Strategist for DailyFX.com
To receive Ilya's analysis directly via email, please SIGN UP HERE
Contact and follow Ilya on Twitter: @IlyaSpivak


