


- Largest net short position for large Cable traders since August 2013
- GBP open interest turns down from record
- Largest increase in large speculative crude net long position since March 2014
For more analysis and trade setups, visit SB Trade Desk
Subscribe to Jamie Saettele's distribution list in order to receive several free reports per week
The COT Index is the difference between net speculative positioning and net commercial positioning measured. A blue colored bar indicates that the difference in positioning is the greatest it has been in 52 weeks (bullish) with speculators selling and commercials buying. A red colored bar indicates that the difference in positioning is the greatest it has been in 52 weeks (bearish) with speculators buying and commercials selling. Non-commercials tend to be on the wrong side at the turn and commercials the correct side. Use of the index is covered closely in detail in my book.
Latest CFTC Release dated January 26th, 2015:
| Week (Data for Tuesdays) | |
|---|---|
| US Dollar | 28 |
| Euro | 84 |
| British Pound | 2 |
| Australian Dollar | 75 |
| Japanese Yen | 96 |
| Canadian Dollar | 26 |
| Swiss Franc | 20 |
| Mexican Peso | 8 |
| Gold | 57 |
| Silver | 75 |
| Copper | 10 |
| Crude | 10 |
Charts (all charts are continuous contract)
Non Commercials (speculators) – Red
Commercials – Blue
Small Speculators – Black
COTDiff (COT Index) – Black
US Dollar ICEUS Continuous Contract
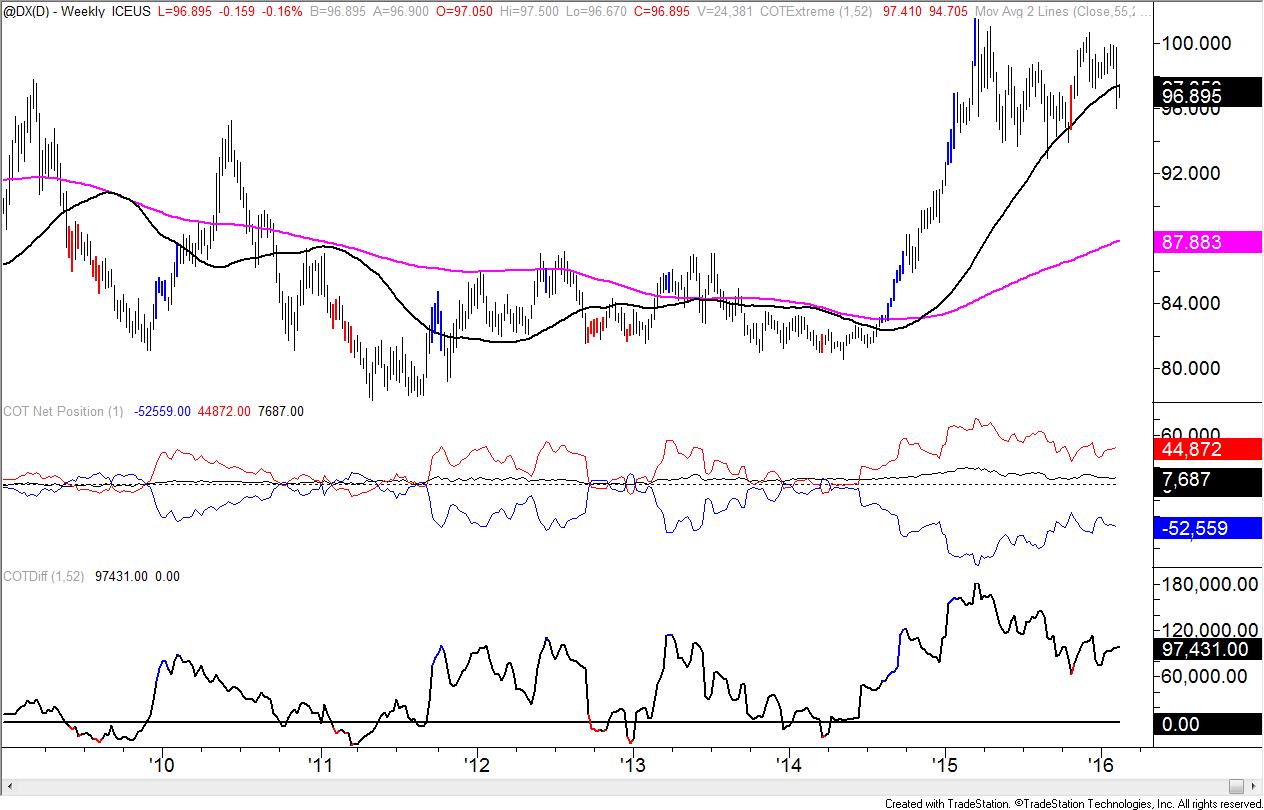
Chart prepared by Jamie Saettele, CMT
Euro CME Continuous Contract
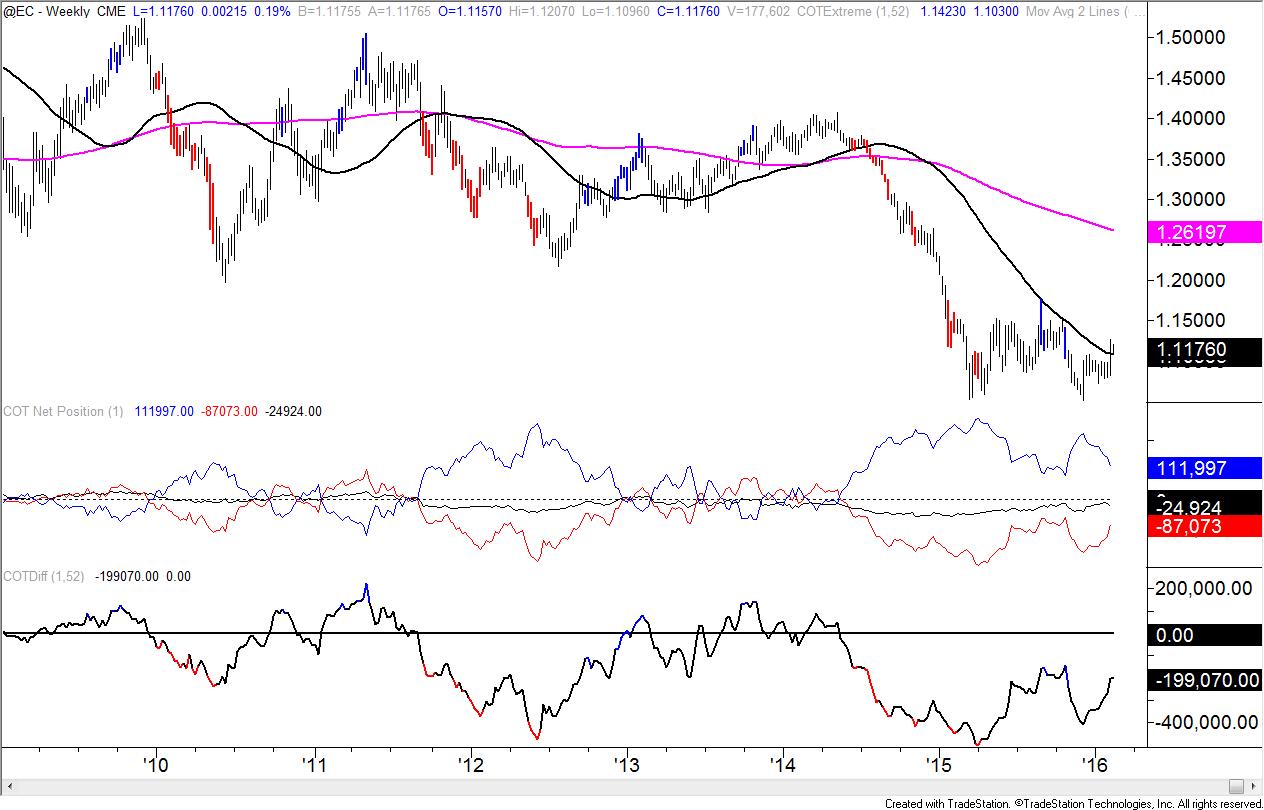
Chart prepared by Jamie Saettele, CMT
Euro CME Continuous Contract
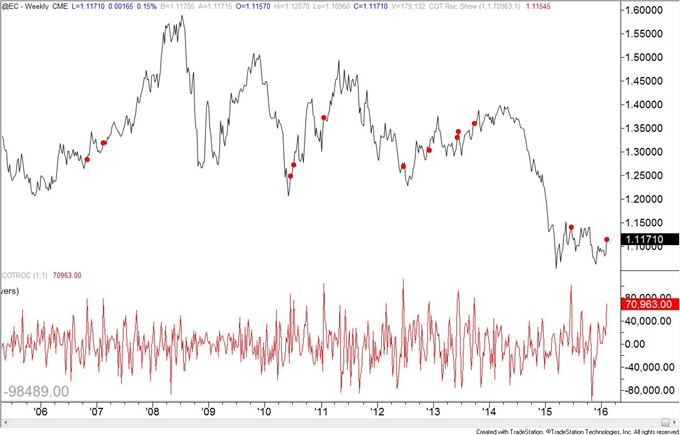
Chart prepared by Jamie Saettele, CMT
The line plotted below price is the 1 week change of net speculative positioning – net commercial positioning. A high reading indicates heavy speculative (trend following) buying and heavy commercial (hedging) selling. The most recent data point is the highest since June. The red dots on the chart indicate values at least as high as the most recent data point. The high reading has led to exhaustion a few times (most recently in June) but more often than not price does continue higher.
British Pound CME Continuous Contract

Chart prepared by Jamie Saettele, CMT
Australian DollarCME Continuous Contract

Chart prepared by Jamie Saettele, CMT
Japanese YenCME Continuous Contract

Chart prepared by Jamie Saettele, CMT
Canadian DollarCME Continuous Contract

Chart prepared by Jamie Saettele, CMT
Swiss Franc CME Continuous Contract

Chart prepared by Jamie Saettele, CMT
Mexican Peso CME Continuous Contract

Chart prepared by Jamie Saettele, CMT
Gold COMEX Continuous Contract

Chart prepared by Jamie Saettele, CMT
Silver COMEX Continuous Contract

Chart prepared by Jamie Saettele, CMT
Copper COMEX Continuous Contract

Chart prepared by Jamie Saettele, CMT
Crude Oil NYMEX Continuous Contract

Chart prepared by Jamie Saettele, CMT
--- Written by Jamie Saettele, CMT, Senior Technical Strategist for DailyFX.com
To contact Jamie e-mail jsaettele@dailyfx.com. Follow me on Twitter for real time updates @JamieSaettele
Jamie is the author of Sentiment in the Forex Market and co-founder of SB Trade Desk.


