


Talking Points:
- Gold stayed bullish ahead of NFP as soft US data hints at rate hike delay
- Oil traded choppy while market sentiment and positioning overshadow fundamentals
- Copper retreated in anticipation of widespread economic fears
Oil supply-demand imbalance is back in focus as market participants try to explain recent puzzling price action. WTI oil price rallied through the last two sessions regardless of a stock build reported by U.S. Department of Energy, before it retreated overnight despite weak USD.
World oil supply has indeed risen over time since 1996, as in the chart below. This was due to production increases in both OPEC countries and the US. US shale oil industry has sped up output sharply since 2008, which led to an oil price war between these two largest producers.
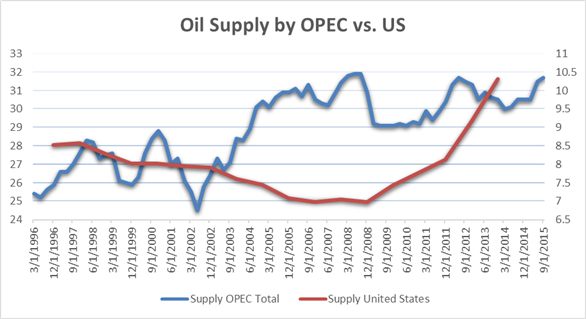
Data by Bloomberg & International Energy Agency (OECD). Chart compiled by DailyFX
Note: US Supply data only up to 2013
However domestic data published by DoE (or the Energy Information Administration) shows another side of this story. U.S. weekly inventories consisting of total crude stocks and Cushing stocks are known to drive market pricing for both WTI and Brent. In the chart below, inventories linger at record peak, however production has started to cool down in 2015. This is in line with declines in rig counts by Baker Hughes Inc. and the on-going consolidations among commodity producers.
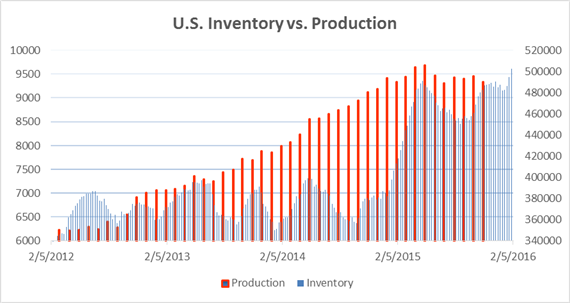
Data by Bloomberg & U.S. Department of Energy. Chart compiled by DailyFX
These data, especially the stabilization of US production, may present fundamental factors supportive to oil prices going forward. They may also help to explain upside swings which sidetracked from short-term data. To oil investors, judgement need to be exercised on whether oil has already hit rock bottom.
Gold price carried on a rally to 1150s today, ahead of the release of US Non-farm Payrolls (NFP). Recent soft US data contributed to bullish gold sentiment, as well as expectation for a delay in Federal Reserve rate hike plan. Fed funds futures today priced in a mere 46.2% chance for a rate hike by December 2016, with the March meeting coming at 10%. As such, the influence of NFP to gold price may be subdued.
Copper price retreated today as market reconsidered metal positions after soft global data. The round of US data misses piled concerns while a China pick-up is nowhere in sight. Lack of production in the fourth quarter, lower factory orders and durable goods were released overnight. Although a weak US dollar is supportive to metal prices, these drivers (of weak USD) will likely lead to a pause in the recent metal rally.
Need a hand to start trading: Free Guides
GOLD TECHNICAL ANALYSIS – Gold price reached up to September’s high at 1157 and could potentially challenge August’s high at 1169.8 above that. Upward momentum is still building up in bullion even as it enters overbought territory. Support trend line holds firm on the downside.
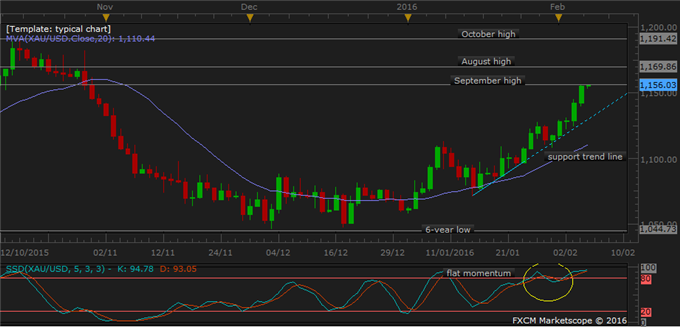
Daily Chart - Created Using FXCM Marketscope
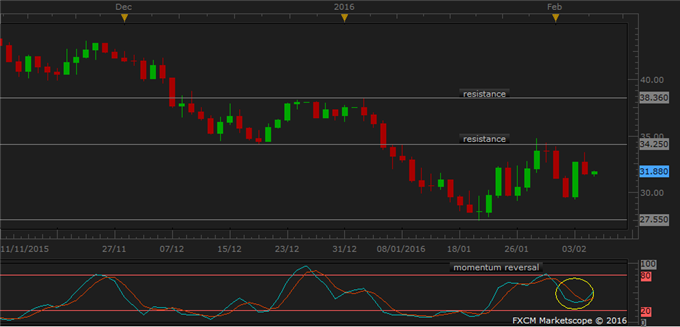
COPPER TECHNICAL ANALYSIS – Copper today shows early signs of a halt of the recent rally. A firm resistance at 2.1485 likely holds though to next week. Support trend line coupled with resistance level to form a narrow range in which copper may consolidate early next week.
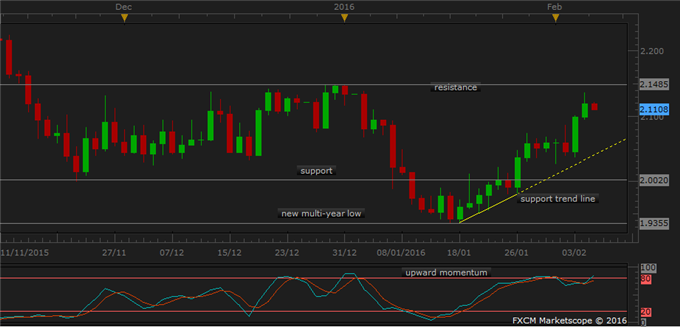
Daily Chart - Created Using FXCM Marketscope
CRUDE OIL TECHNICAL ANALYSIS – WTI oil reversed down again, which confirmed the lackluster of clear direction in oil market. Range trade dominates in the near term, however heightened volatility may lead to unexpected price action.
Daily Chart - Created Using FXCM Marketscope
--- Written by Nathalie Huynh, Currency Strategist for DailyFX.com
Want to read market’s momentum: Speculative Sentiment Index
Losing Money Trading Forex? This Might Be Why.
Contact and follow Nathalie on Twitter: @nathuynh


