


Talking Points:
- Traders can use support and resistance to grade market conditions, define trends, and enter positions.
- We discuss ‘static’ methods of support and resistance in the below article.
- We delve into pivot points, and psychological support/resistance analysis.
One of the first aspects of technical analysis that most new traders learn is the field of support and resistance.
After all, if price has hit a floor with which it may have difficulty breaking through (support) or a ceiling with which it may not be able to rise above (resistance); this can offer a plethora of trade ideas and setups.
Unfortunately, most new traders learn one or two ways of identifying support or resistance; and when they see that it doesn’t work all-of-the-time, they abandon such studies in hopes of finding ‘holy grails’ elsewhere.
Well, holy grails don’t really exist. It often takes the new trader some time to learn this lesson the hard way: There is no strategy or approach or indicator that will allow a trader to always win, no matter how strong the analytical method being employed. Rather, trading is about probabilities and attempting to get them on your side or in your favor as much as humanely possible using this analysis.
Support and resistance has a special role in this analysis. It can be used to grade market conditions, determine trends, identify entry and exit points along with a bevy of other options.
In this article, we’re going to look at the most popular ways of identifying ‘static’ support and resistance levels on the chart; and in our next article we’ll look at more dynamic methods like Fibonacci and Price Action. In the following three pieces, we’ll take this a step further in showing how traders can properly use these levels in their analysis.
Pivot Points
This is one of the more common mannerisms of identifying support and resistance, and it’s also one of the oldest. Pivot points originated before computers became common in financial markets as floor traders need a quick and easy way to see if prices were ‘cheap’ or ‘expensive.’
So these floor traders developed a short-hand manner of getting support (cheap) and resistance (expensive) levels.
These floor traders would take the previous day’s high, low, and closing prices and would average these values together to find the ‘pivot’ for the next trading day. Price action trading above this pivot would be ‘bullish’ while prices below would be ‘bearish.’
While this is fine and good, it doesn’t tell us much about support or resistance yet; so to take this a step further, traders would then multiply the pivot by two, and would then subtract the previous day’s low to get the first level of resistance (R1). They can then do the same to find the first level of support (S1), multiplying the pivot value times two and then subtracting the previous day’s high.
After the R1 and S1 values are solved, traders can then move on to the next levels of support and resistance. To find the second level of resistance (R2), traders can add the pivot value to the difference between R1 and S1; and the second level of support could be found by subtracting the difference between R1 and S1 from the pivot value. The full equation is below:
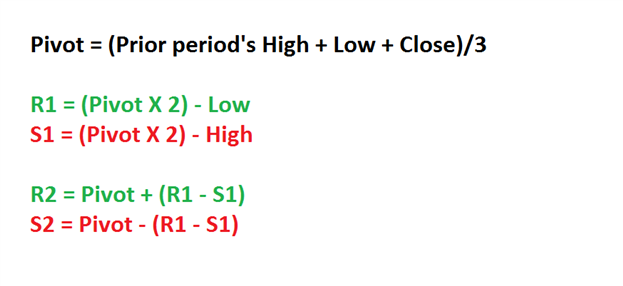
As you can see from the equation, pivot points use very basic math to find potential support and resistance levels. Luckily for traders, most charting packages will automatically do this math for us while plotting the support and resistance levels at appropriate intervals.
Pivot Points can be generated for a variety of time frames, and the longer-term pivots will often work best as more traders may be seeing and reacting to those levels.
As with most forms of technical analysis, the longer the term being used in the analysis the stronger the response that may be elicited. Pivot points of monthly and weekly flavors will often attract significant interest, and should be followed by traders even if using shorter-term hourly and four-hour charts.
Monthly and Weekly Pivot Points can bring value on long as well as short time frames
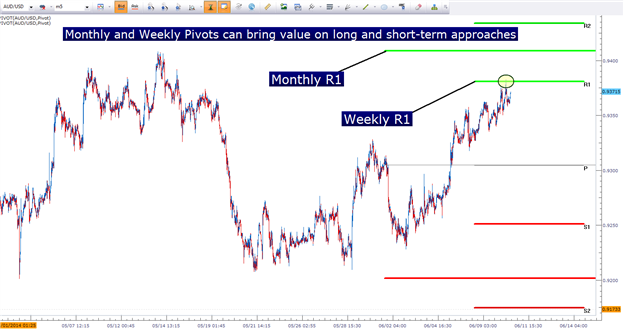
Created with Marketscope/Trading Station II; prepared by James Stanley
Psychological Levels
One of the most alluring aspects of technical analysis is the ability of statistics and mathematics to show patterns in human behavior. Nowhere is this more prominent than in the study of ‘psychological’ levels in financial markets.
Most human beings think in even rounded whole numbers. We can’t help it; our species has evolved to value simplicity. As an example, ask someone how much they paid for their car or their jacket, or even their latte.
They’ll likely round their answer up (or down) to the nearest round number. This type of rounding will often happen in markets as well; as traders place their stops or entry orders at or around these levels in the same way that most human beings will respond when asked how much they paid for their coffee.
We delved in the topic of psychological whole numbers in support and resistance identification in the article, The Hidden Patterns of Support and Resistance in the Forex Market. In the chart below, we look at the ‘Major’ and ‘Less-Major’ psychological support and resistance levels in GBPUSD.
GBPUSD Weekly chart with ‘Major,’ and ‘Less Major’ levels identified
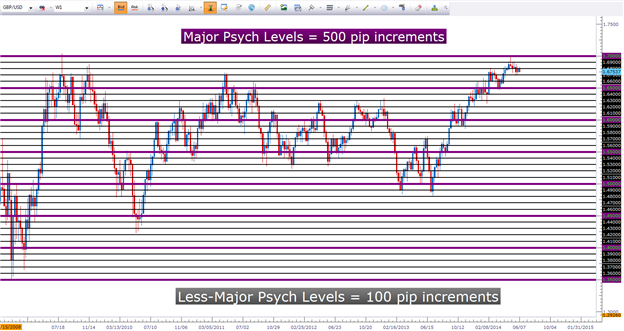
Created with Marketscope/Trading Station II; prepared by James Stanley
As you can see, these levels can come up quite often in a market, particularly during strong trends as new prices run into fresh resistance levels (or support levels in the case of a down-trend).
This study of support and resistance can be taken a step further with the ‘minor’ prices that are set in 25-pip increments; known as the ‘minor’ psychological levels. In the chart below, we’ve moved down to the hourly chart in the same market looked at above (GBPUSD) with the addition of these more granular ‘minor’ levels:
Hourly GBPUSD with Minor psychological levels added (25-pip increments)
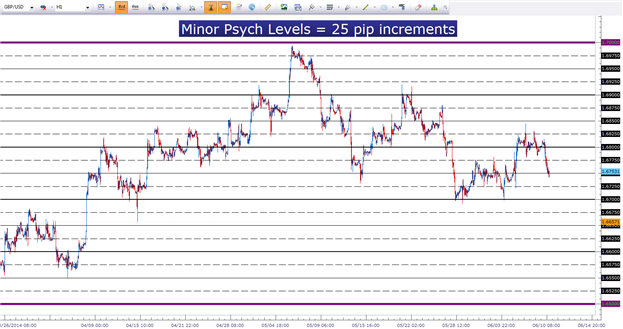
Created with Marketscope/Trading Station II; prepared by James Stanley
With psychological levels taking place every 25 pips, there are numerous opportunities for traders to ‘catch swings’ in a market.
To put more power behind psychological levels or pivot points, traders can look for confluence amongst these analytical methods; including the dynamic support and resistance mechanisms that we’ll investigate in our next installment.
--- Written by James Stanley
Before employing any of the mentioned methods, traders should first test on a demo account. The demo account is free; features live prices, and can be a phenomenal testing ground for new strategies and methods. Click here to sign up for a free demo account through FXCM.
James is available on Twitter @JStanleyFX
Are you looking to take your trading to the next level? The DailyFX 360° Course offers a full curriculum, along with private, weekly webinars in which we walk traders through dynamic market conditions using the education taught in the course.
Would you like to trade alongside seasoned professionals throughout the trading day? DailyFX On Demand gives you access to DailyFX Analysts during the most active periods of the trading day.
Would you like to enhance your FX Education? DailyFX has recently launched DailyFX University; which is completely free to any and all traders!
We’ve recently begun to record a series of Forex Videos on a variety of topics. We’d greatly appreciate any feedback or input you might be able to offer on these Forex videos:


