
Most Read: USD/JPY Forecast - Hot US Inflation Sparks Bullish Breakout, Key Levels Ahead
GOLD PRICE FORECAST - ANALYSIS
Gold prices (XAU/USD) plunged and reached their weakest point in two months on Tuesday after higher-than-anticipated U.S. CPI data sparked a hawkish repricing of Fed interest rate expectations, boosting U.S. Treasury yields and the U.S. dollar across the board.
With progress on disinflation stalling, the U.S. central bank may delay the start of its easing cycle and opt for only modest rate cuts when the process gets underway. This could mean higher bond yields and a stronger U.S. currency for longer, a situation that could exert downward pressure on precious metals.
From a technical point of view, gold sank below $2,005 and quickly descended towards its 50-day simple moving average at $1,990. If prices fail to stabilize around these levels and extend to the downside, we could soon see a move towards $1,975. On further weakness, all eyes will be on $1,965.
In the event of a bullish reversal, which seems improbable at the moment given the lack of positive catalysts, resistance looms around $2,005. Beyond this technical ceiling, the focus will shift to the 50-day simple moving average hovering near $2,030.
Wondering how retail positioning can shape gold’s trajectory in the near term? Our sentiment guide provides the answers you are looking for and outlines key strategies—don't miss out, get the guide now!
| Change in | Longs | Shorts | OI |
| Daily | 15% | -10% | 3% |
| Weekly | 13% | -6% | 5% |
GOLD PRICE CHART – TECHNICAL ANALYSIS
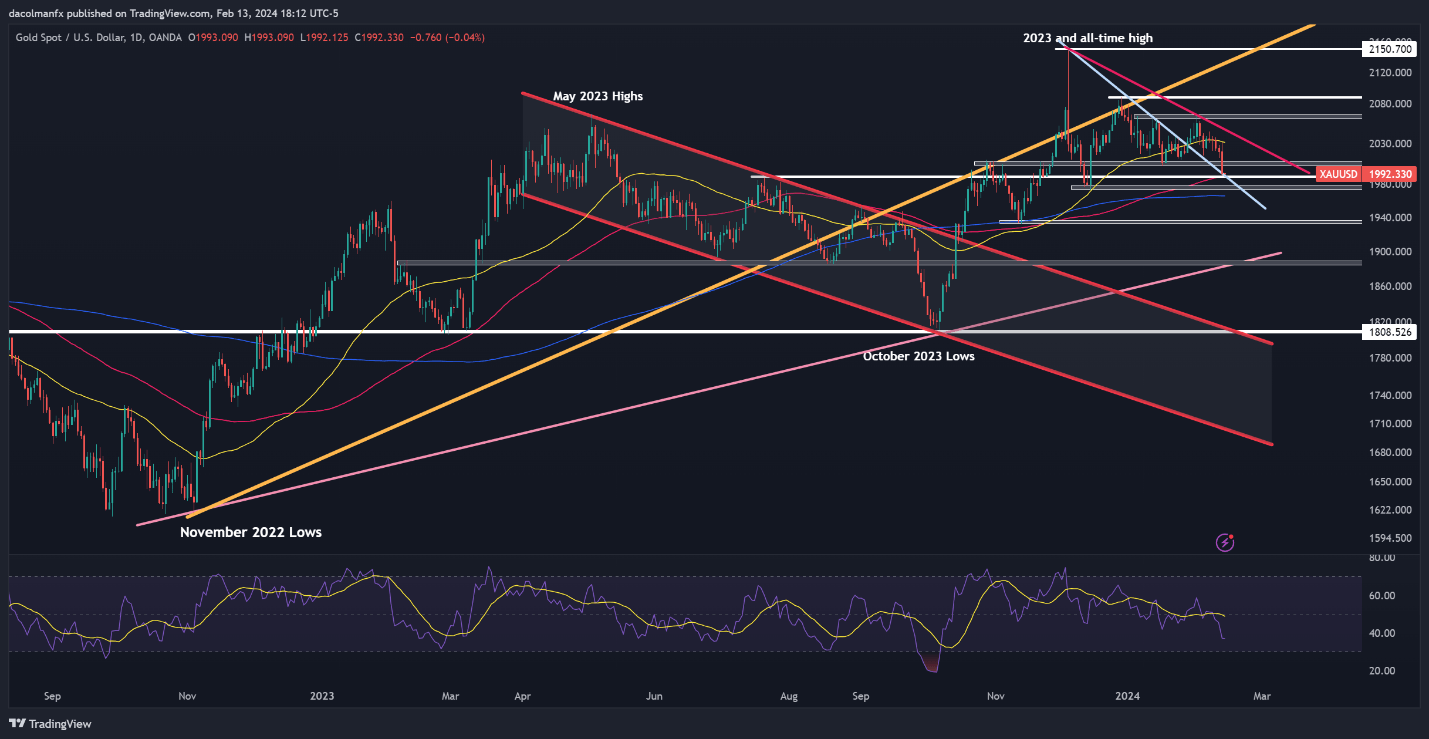
Gold Price Chart Created Using TradingView
If you're looking for an in-depth analysis of U.S. equity indices, our first-quarter stock market trading forecast is packed with great fundamental and technical insights. Get it now!
NASDAQ 100 FORECAST - ANALYSIS
The Nasdaq 100 suffered a severe setback on Tuesday, falling more than 1.5%, on the back of rising U.S. rates following higher-than-expected CPI numbers. With yields pushing towards fresh highs for the year, stocks will have a hard time staying afloat, meaning a large correction could be around the corner.
In terms of relevant technical thresholds, the first key support to watch appears at 17,555, which corresponds to a short-term uptrend line extended from the October lows. Should prices fall below this area, the crosshairs will fall squarely on 17,150, slightly above the 50-day simple moving average.
On the other hand, if bulls manage to mount a comeback and trigger a meaningful rebound, resistance emerges at the all-time high around 18,125. Sellers are expected to vigorously guard this ceiling, but in case of a breakout, the tech index may find itself gravitating towards 18,300.
NASDAQ 100 CHART – TECHNICAL ANALYSIS
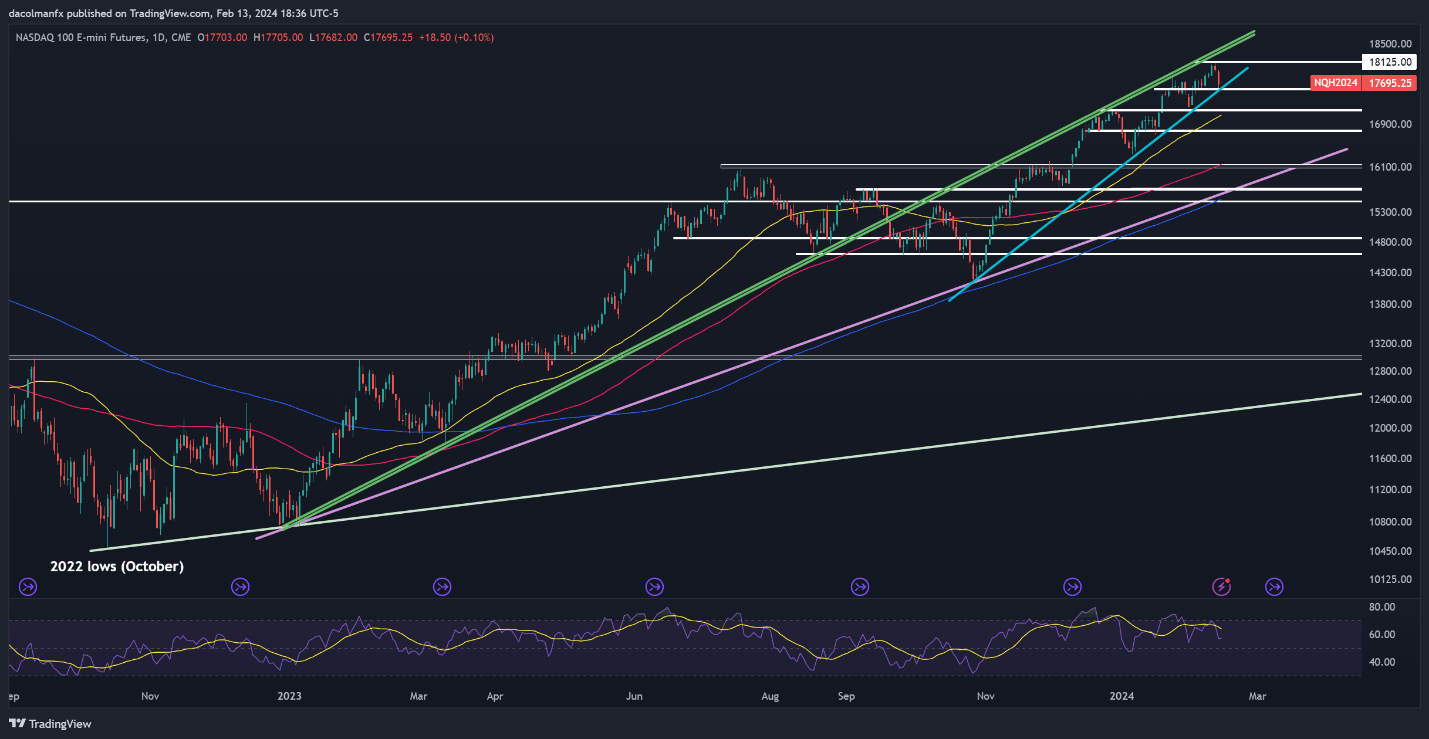
Nasdaq 100 Chart Created Using TradingView
For a comprehensive analysis of the euro’s medium-term prospects, make sure to download our complimentary Q1 trading forecast today.

EUR/USD FORECAST - ANALYSIS
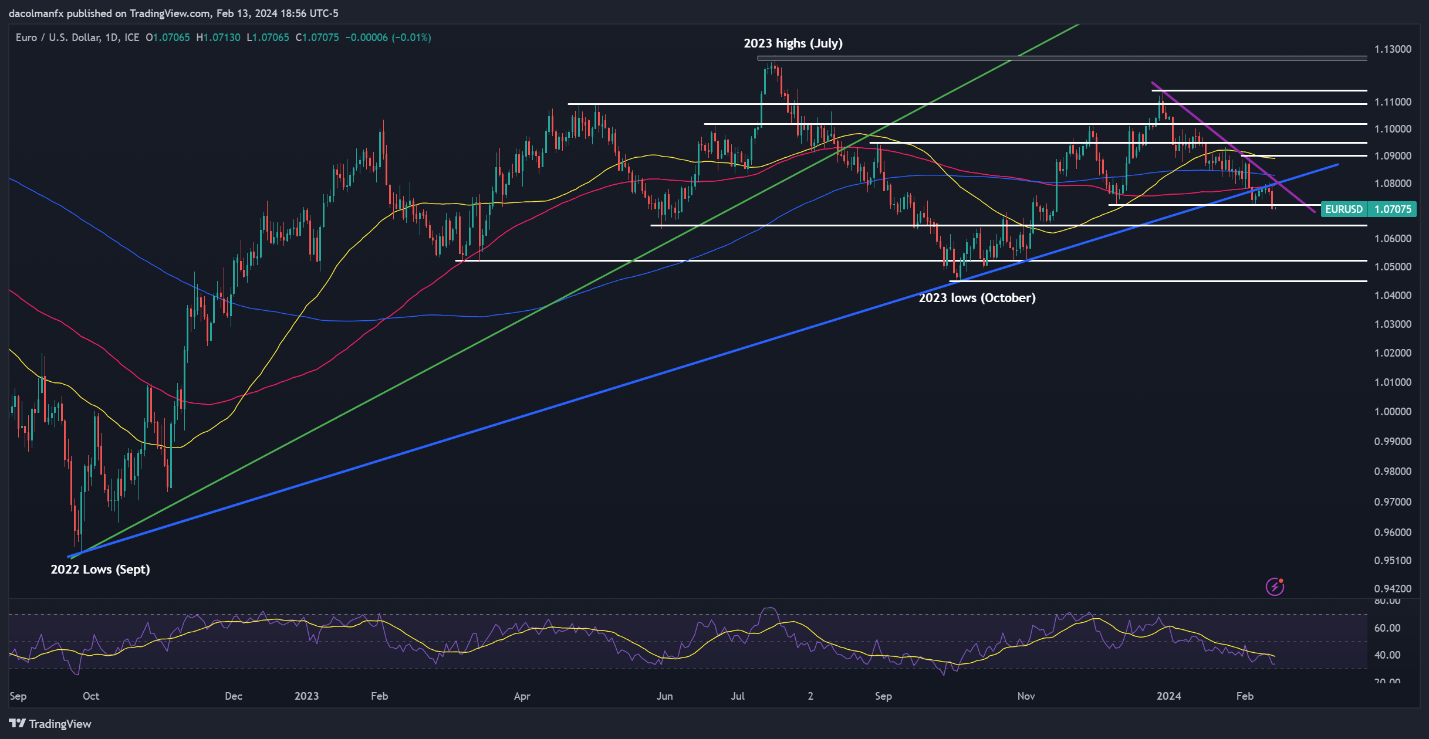
EUR/USD dropped sharply on Tuesday, hitting its lowest level in three months and closing below support at 1.0720. If this breakdown is sustained in the coming days, sellers may be emboldened to initiate an assault on 1.0650. Continued losses from this point onward could turn the spotlight to 1.0520.
Conversely, if buyers regain the upper hand and spark a turnaround, the first technical hurdle to monitor can be spotted in the vicinity of 1.0720. Above this area, the next resistance zone of interest lies near 1.0800, where the 100-day simple moving average aligns with a short-term descending trendline.
EUR/USD CHART – TECHNICAL ANALYSIS