Most Read: EUR/USD Trade Setup: Bullish Continuation Hinges on Resistance Breakout
Gold prices plunged this week after briefly hitting an all-time high on Monday, sinking more than 3% to settle slightly below the $2,335 mark. The selloff was driven primarily by the rally in short-term Treasury yields following hawkish Fed minutes and better-than-expected U.S. PMI data, which showed that business activity in the services sector accelerated to its strongest pace in over two years in May, a sign that the economy is holding up remarkably well and is able to tolerate higher interest rates for longer.
With inflationary pressures proving to be stickier than initially anticipated and the prospects of central bank easing pared back on account of economic resilience, U.S. Treasury yields may have room to move a little higher in the near term, especially those on the front end of the curve. This, in turn, could keep the U.S. dollar biased upwards, preventing bullion from making another attempt at fresh records heading into the end of the month.
For an extensive analysis of gold’s fundamental and technical outlook, download our complimentary quarterly trading forecast now!

While gold’s very near-term outlook appears neutral to slightly bearish, we will need to reassess this view late in the upcoming week when fresh core personal consumption expenditures price data, the Fed's preferred inflation measure, is released. Consensus estimates indicate that the underlying PCE deflator advanced 0.3% in April, bringing the annual reading down to 2.7% from 2.8% previously, a small step in the right direction and welcome news for policymakers.
For gold to reverse course and resume its upward trend, bulls need to see the core PCE report surprise to the downside. Such an outcome could reignite optimism that the disinflationary trend, which began in late 2023 but stalled earlier this year, is back on track, strengthening the argument for the Federal Reserve to start dialing back on policy restraint early in the fall. As it stands, there is about a 45% chance of a 25-bps rate cut occurring at the September FOMC meeting.
Wondering how retail positioning can shape gold prices in the near term? Our sentiment guide provides the answers you are looking for—don't miss out, get the guide now!
| Change in | Longs | Shorts | OI |
| Daily | 1% | 0% | 0% |
| Weekly | -21% | 35% | -3% |
FOMC MEETING PROBABILITIES
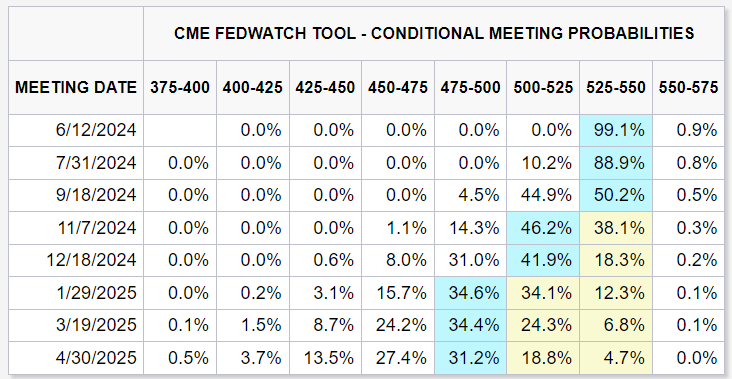
Source: CME
In the event of red-hot inflation numbers that top Wall Street’s forecasts, interest rate expectations are likely to drift higher as traders push out the timing of the first rate cut, possibly to November or December. This could boost yields and the greenback, fostering a hostile environment for precious metals. Higher yields typically reduce the appeal of non-interest-bearing assets such as gold and silver, while a stronger dollar increases their cost for overseas buyers, suppressing their demand.
Acquire the knowledge needed for maintaining trading consistency. Grab your "How to Trade Gold" guide for invaluable ideas and tips!

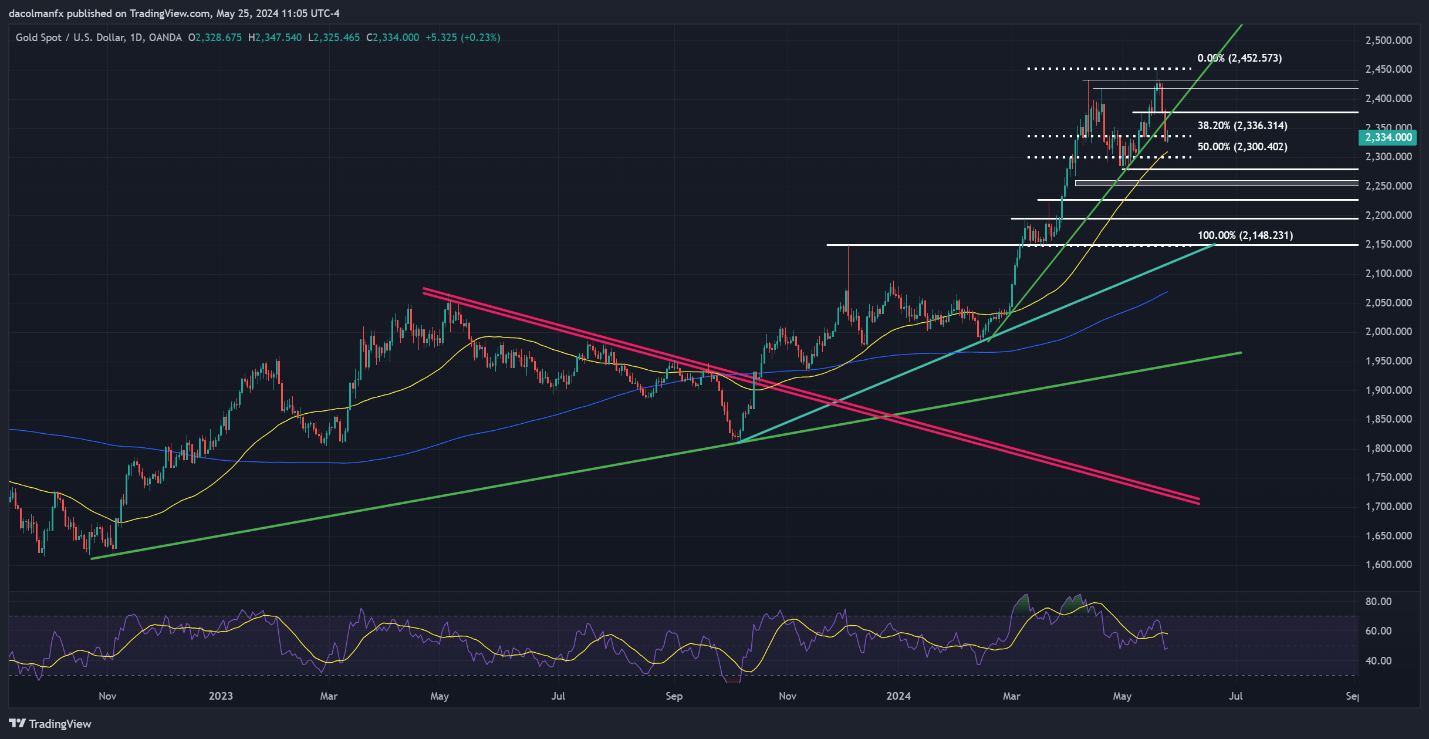
GOLD PRICE TECHNICAL ANALYSIS
Gold (XAU/USD) plummeted this week, slipping below a key trendline at $2,360 and the 38.2% Fibonacci retracement of the 2024 advance at $2,335. With bearish momentum seemingly accelerating, sellers could soon make a move on the 50-day SMA at $2,310. On further weakness, the focus will be on the psychological $2,300 threshold, followed by $2,280, May’s swing low.
In case of a market rebound, resistance could manifest near the $2,375 zone. Surmounting this technical ceiling could prove challenging, yet a breakout could encourage buyers to launch an assault on $2,420. Additional gains beyond this point could set the stage for a rally towards $2,430, with the all-time high at $2,450 representing the next noteworthy bullish target to keep an eye on.
GOLD PRICE TECHNICAL CHART