


U.S. DOLLAR ANALYSIS & TALKING POINTS
- Higher terminal rate > less aggressive rate hikes.
- U.S. ISM non-manufacturing PMI in focus.
- Falling wedge breakout potential on daily chart.
Trade Smarter - Sign up for the DailyFX Newsletter
Receive timely and compelling market commentary from the DailyFX team
USD FUNDAMENTAL BACKDROP
The Dollar Index’s (DXY) rallied after last nights Federal Reserve interest rate decision bringing the Fed funds target rate to 3.75-4% after the 75bps increase. Fed Chair Jerome Powell reinforced the Fed’s intention to stamp out entrenched inflationary pressures while mentioning that the size of future hikes will likely be reduced but at a higher end point. This higher ‘end point’ is what surprised markets somewhat as pre-announcement, money markets had the peak around 5% in May 2023 which has now increased to 5.133% as of this morning – see table below.

FEDERAL RESERVE INTEREST RATE PROBABILITIES
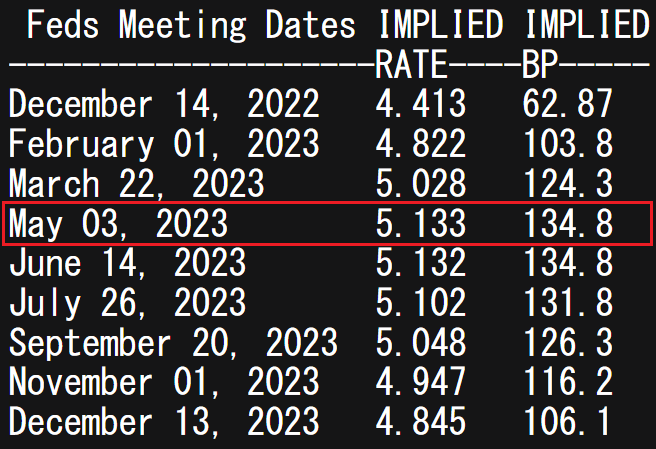
Source: Refinitiv
The continued rate hikes (albeit less aggressive) will not bode well for Emerging Market (EM) currencies as their traditional carry trade appeal will be diminished with most of these economies unable to keep up with the pace of rate hikes in the U.S..
Later today, ISM services PMI for October is due which is the primary driver of the U.S. economy. After Monday’s manufacturing print, a services beat would likely add additional upside support for the greenback. Prior to FOMC, ADP employment figures surprised higher heightening the importance of Friday’s NFP release.
ECONOMIC CALENDAR
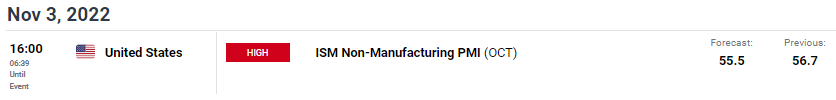
Source: DailyFX economic calendar
TECHNICAL ANALYSIS
U.S. DOLLAR INDEX DAILY CHART
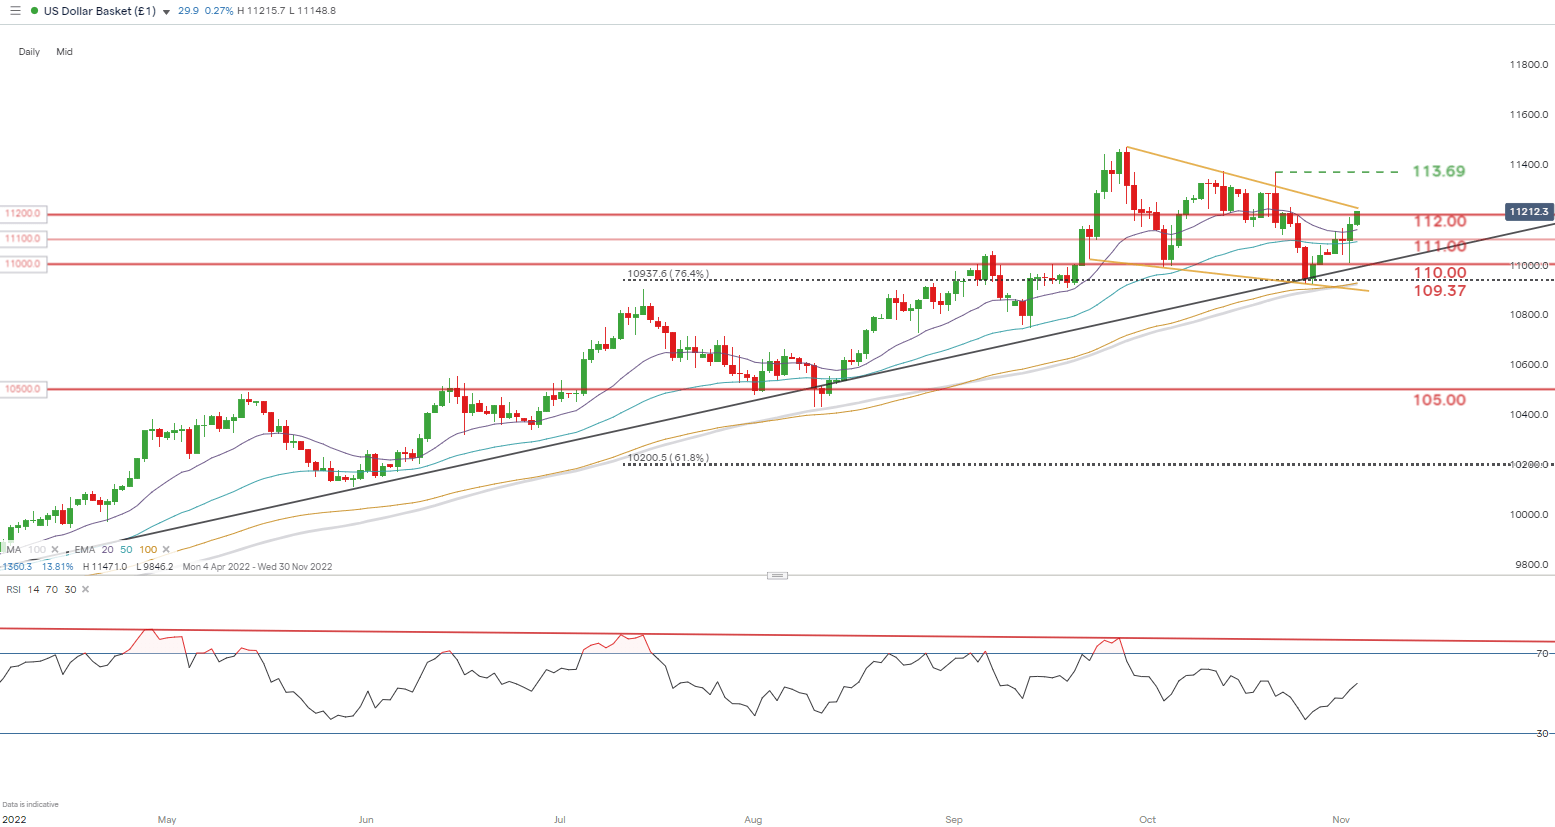
Chart prepared by Warren Venketas, IG
Price action on the daily DXY chart shows bulls testing the developing falling wedge chart pattern (yellow) after surpassing the psychological 112.00 handle. A confirmation daily candle close above wedge resistance could spark a extended run up to subsequent resistance zones – highly dependent on fundamental economic data (NFP on Friday).
shows bears defending the 76.4% Fibonacci (taken from July 2001 high to March 2008 low) level at 109.37. The Relative Strength Index (RSI) shows signs of bearish divergence suggesting an impending reversal. This could fall in line with a hawkish ECB rate decision on Thursday but longer-term it is difficult to see a buck of the enduring upward trend.
Resistance levels:
- 113.69 – recent swing high
- Wedge resistance (yellow)
Support levels:
- 112.00
- 20-day EMA (purple)
- 111.00
Introduction to Technical Analysis
Technical Analysis Chart Patterns
Recommended by Warren Venketas
Contact and followWarrenon Twitter:@WVenketas


