


S&P 500, SPX, NASDAQ 100, NDX - OUTLOOK:
- The S&P 500 index and the Nasdaq 100 index have retreated from key resistance.
- Markets will be looking for indications of a Fed pivot from Powell’s tone and comments later Thursday.
- What are the outlook and the key levels to watch in the S&P 500 and the Nasdaq 100 index?
Elevate your trading skills and gain a competitive edge. Get your hands on the U.S. dollar Q4 outlook today for exclusive insights into key market catalysts that should be on every trader's radar.

US equity indices will be looking for cues from US Federal Reserve Chair Jerome Powell who is scheduled to speak later Thursday. That’s because, over the past couple of weeks, there has been a distinct shift in Fed rhetoric, even from some of the hawkish members. Several Fed officials have indicated a pause in hiking interest rates given the tightening in financial conditions as a result of the surge in Treasury yields.
Minutes of the September FOMC meeting outlined the case for proceeding carefully in determining the extent of additional tightening, noting that participants generally judged that risks had become more two-sided. Pricing for the Fed terminal rate has reduced following the recent comments from Fed officials.
Markets have been grappling with a mix of factors, including mounting tensions in the Middle East, elevated US yields, third-quarter earnings season, light equities positioning, and generally positive seasonality. Participants will be looking for a justification of the dovish market pricing from Powell’s tone and comments.
S&P 500 240-Minute Chart
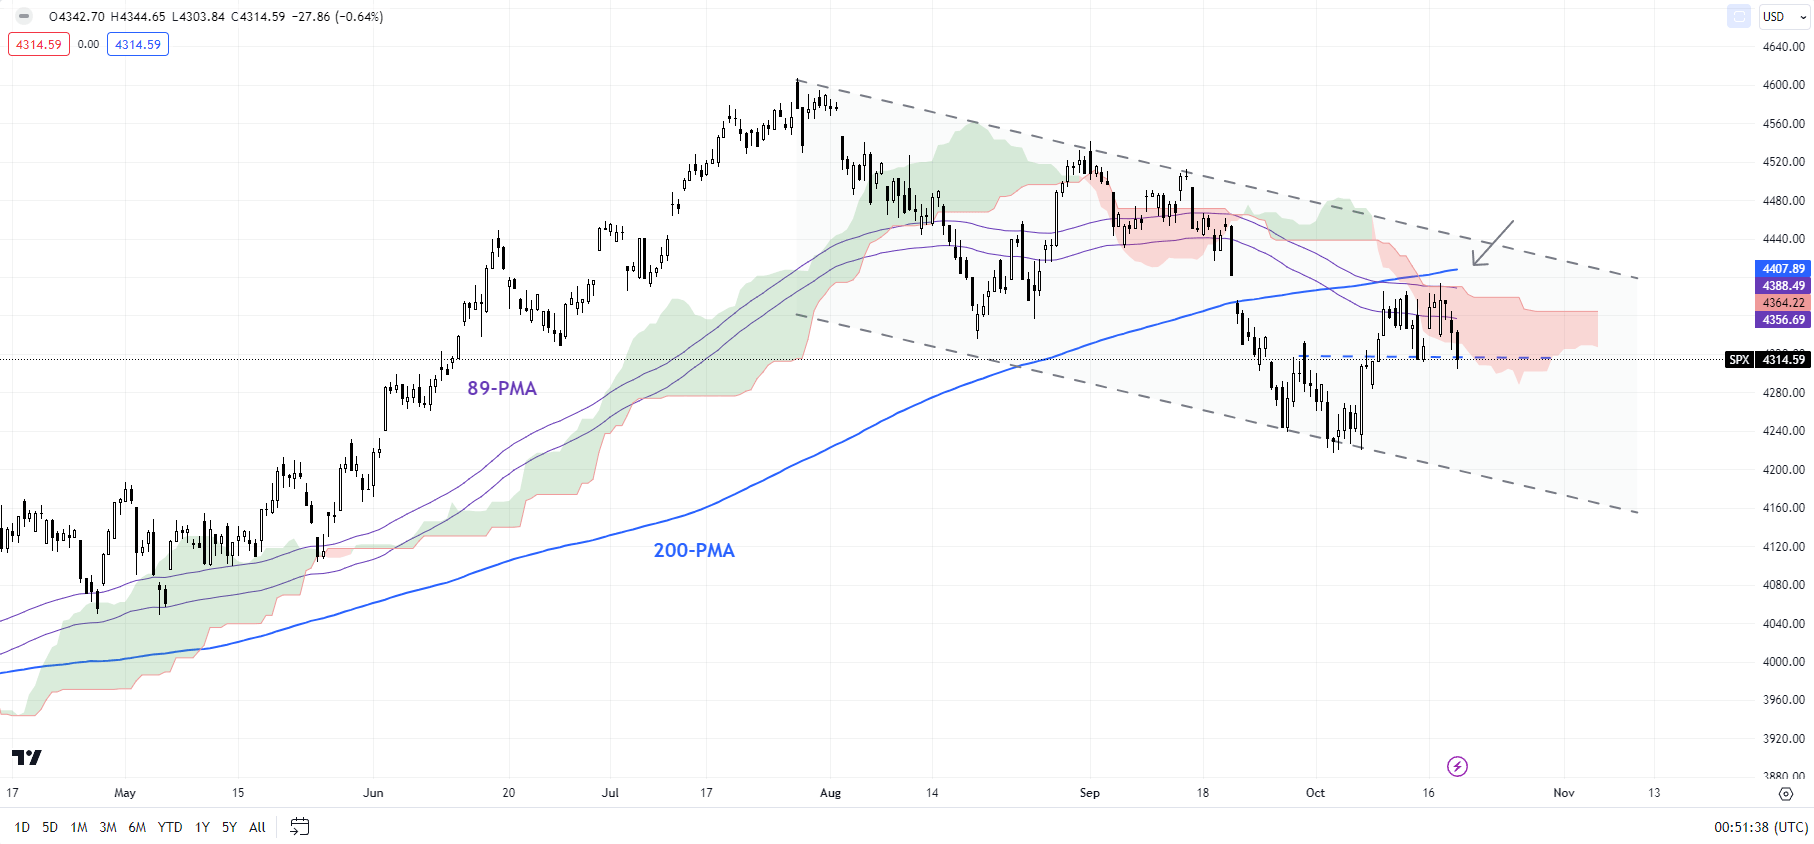
Chart Created by Manish Jaradi Using TradingView
S&P 500: Capped at vital resistance
On technical charts, the S&P 500 index has pulled back from key converged resistance on the 200-period moving average the upper edge of the Ichimoku cloud on the 240-minute charts, and the 89-day moving average. While the price action is still unfolding, the recent price action raises the odds that the near-term trend is at best sideways, as highlighted in the previous update. See “S&P 500 & Nasdaq Rebound from Key Support; How Much More Upside?” published October 10.
Looking for actionable trading ideas? Download our top trading opportunities guide packed with insightful tips for the fourth quarter!

The index has been nicely guided lower by a declining channel since July, with the cloud structure also changing in recent months, as highlighted in late September. See “US Indices Risk Support Test After Hawkish Fed: S&P 500, Nasdaq Price Action,” published September 21.
It is now testing a key cushion at Friday’s low of 4377. Any break below could pave the way toward the early October low of 4215. Any break below the 200-day moving average could expose the downside initially toward the end-April low of 4050.
S&P 500 Daily Chart
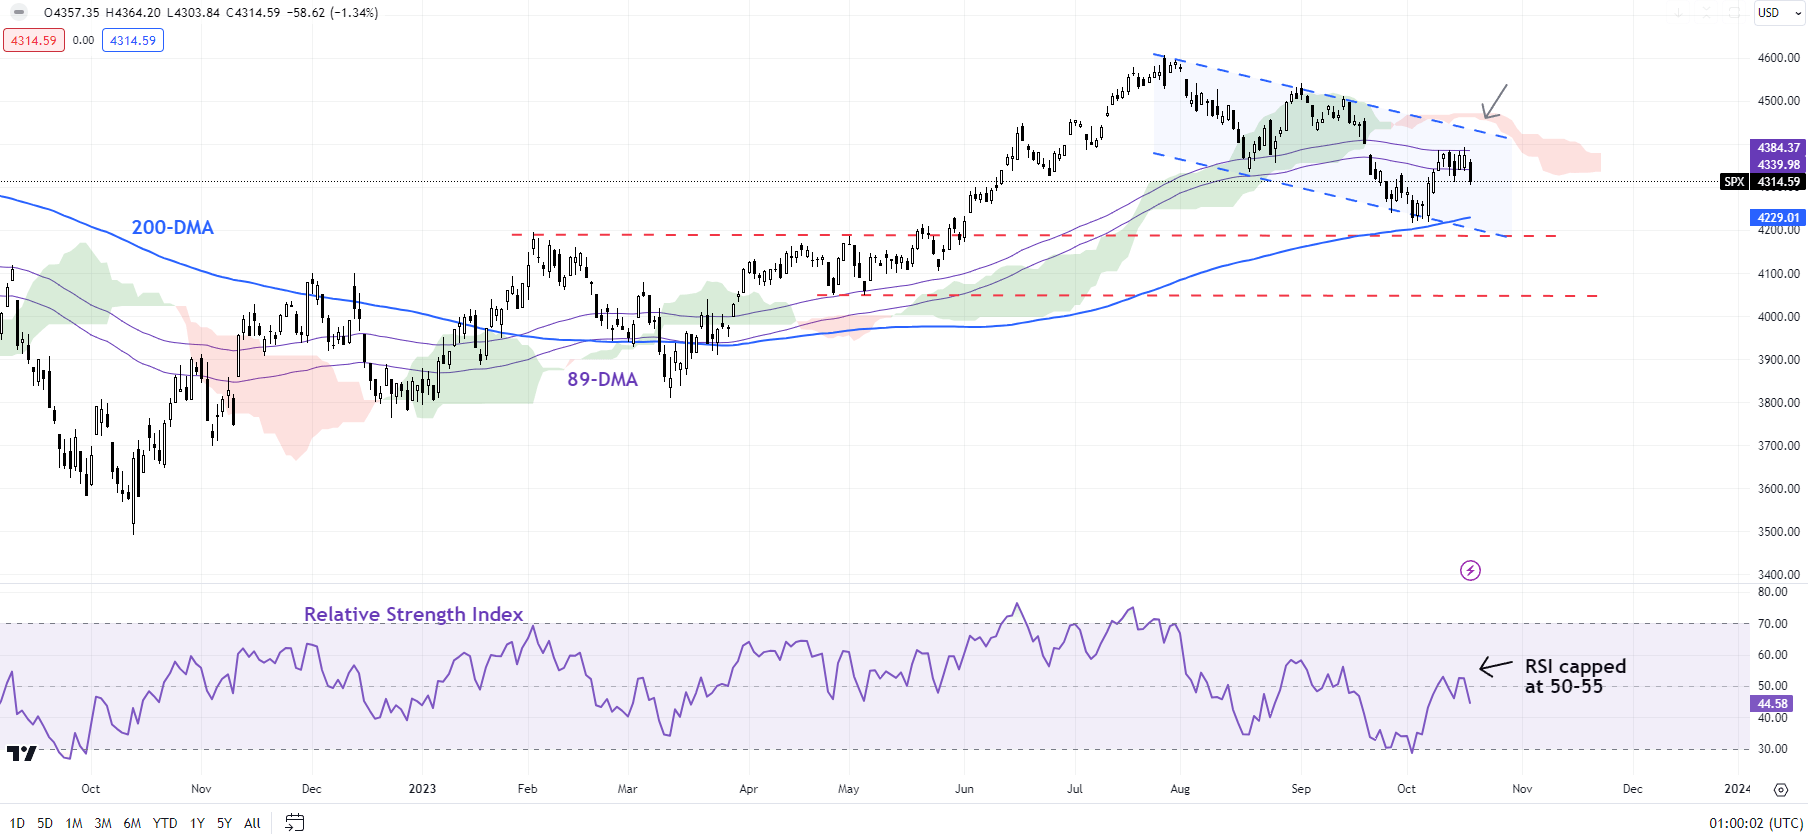
Chart Created by Manish Jaradi Using TradingView
Zooming out from a multi-week perspective, the weakness since August reinforces the broader fatigue, as pointed out in previous updates. See “US Indices Hit a Roadblock After Solid Services Print: S&P 500, Nasdaq,” published September 7; “US Indices Rally Beginning to Crack? S&P 500, Nasdaq Price Setups,” published August 3; “S&P 500, Nasdaq 100 Forecast: Overly Optimistic Sentiment Poses a Minor Setback Risk,” published July 23.
Nasdaq 100 Daily Chart
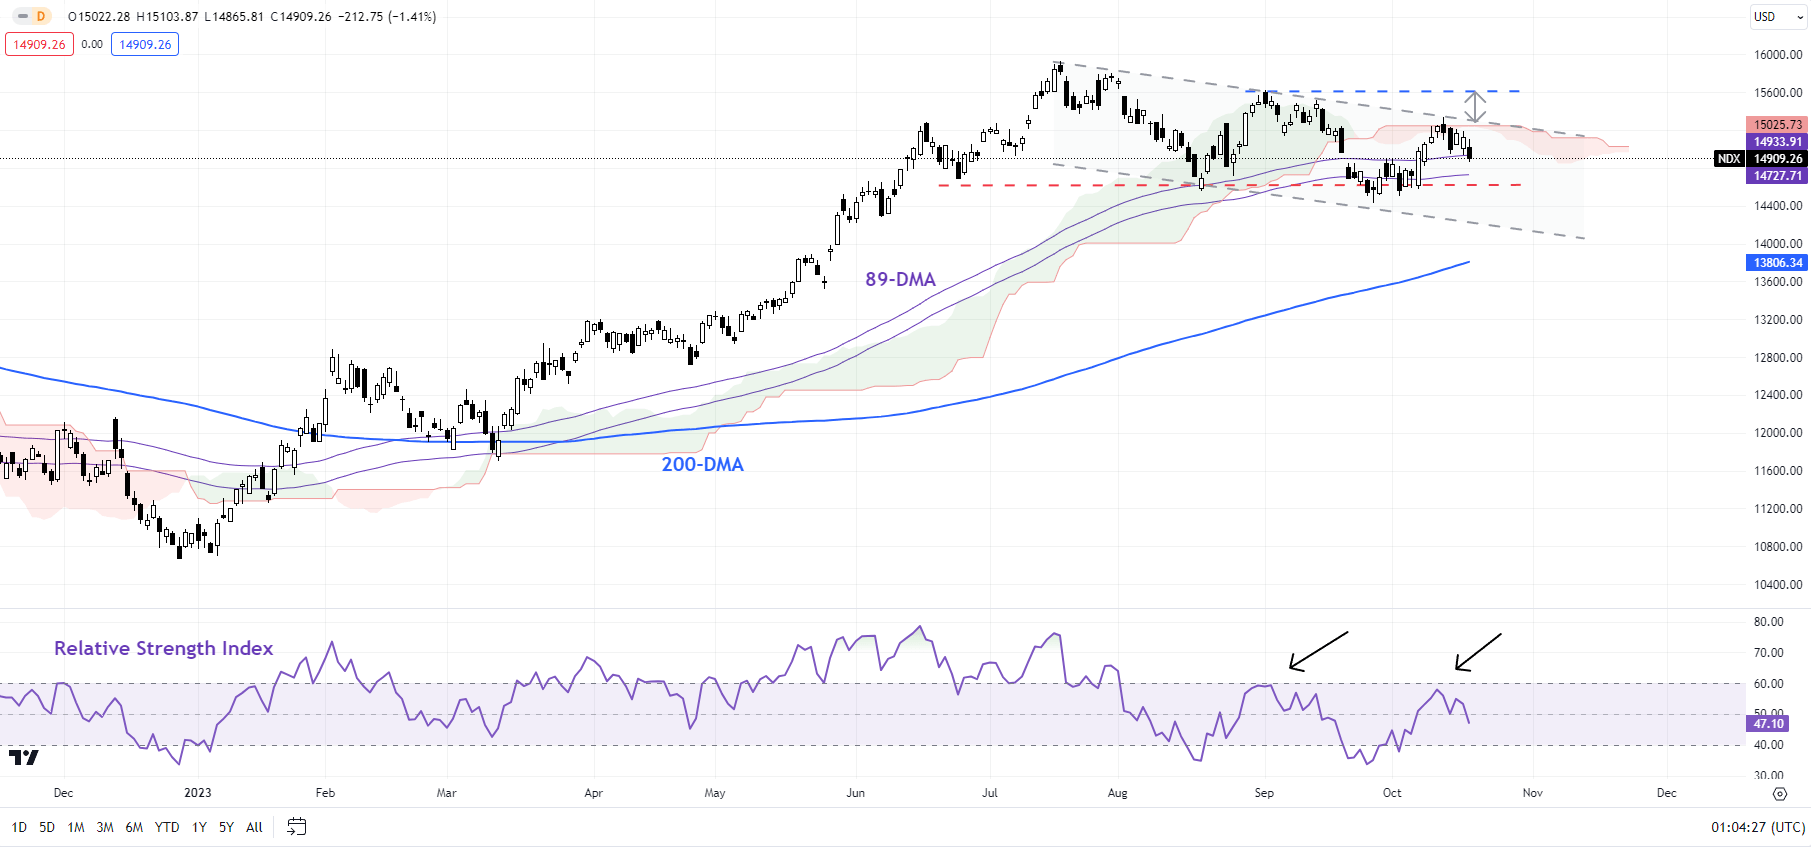
Chart Created by Manish Jaradi Using TradingView
Nasdaq 100: Channel resistance holds
The Nasdaq 100 index has retreated from a stiff hurdle on the upper edge of a declining channel since July, not too far from the early-September high of 15618 and the July high of 15932. While the price action is still unfolding, the lower high created last week raises the risk of a retest of the September low of 14435. This support is crucial as any break below would disrupt the higher-highs-higher-lows sequence established since the start of the year.
From a big-picture perspective, as highlighted in arecent update, the momentum on the monthly charts has been feeble compared with the huge rally since late 2022, raising the risk of a gradual weakening, similar to the gradual drift lower in gold since May. For more discussion, see “Is Nasdaq Following Gold’s Footsteps? NDX, XAU/USD Price Setups,” published August 14.
Curious to learn how to trade ranging markets? Here’s one way to explore —download it now!


