

US Dollar Vs Euro, British Pound, Japanese Yen – Outlook:
- The US dollar index (DXY) has retreated from key resistance.
- Key focus is now on US CPI data due Wednesday.
- What’s next for EUR/USD, GBP/USD, and USD/JPY?

A mixed US jobs data released on Friday points to a limited upside in the US dollar ahead of the key US inflation data due on Thursday.
The greenback fell quite sharply, nearly erasing all of the week’s gains after a not-so-bearish jobs report. Non-farm payrolls increased less than expected, the unemployment rate fell while average hourly earnings came in higher than expected. Granted the demand for jobs is slowing, but the labor market remains tight for now.
The market’s response to a rather mixed set of numbers is like the recent past – below-expected data has had an outsized response in USD, but upbeat data has failed to have a lasting impact. Despite the US Economic Surprise Index being at its highest since early 2021, the DXY Index (US dollar index) is around its year-to-date lows. For more discussion, see “Renewed Weakness in US Dollar: EUR/USD, GBP/USD, USD/JPY Price Setups,” published July 16.
Global Inflation and US Economic Surprise Index
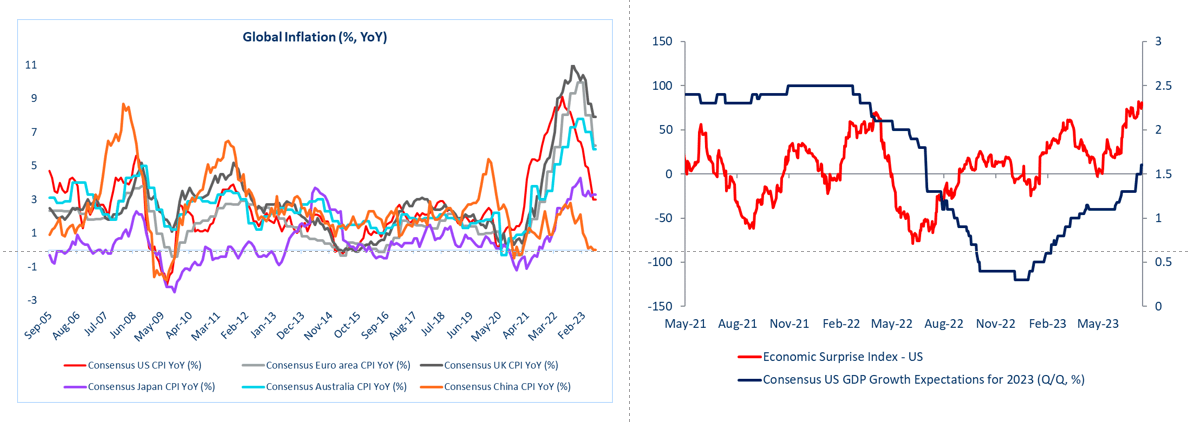
Source Data: Bloomberg; Chart created in Microsoft Excel
The key focus is now on US CPI data due Wednesday. Core CPI is expected to have eased to 4.7% on-year in July from 4.8% previously. The next few weeks will be critical in determining whether the Fed and ECB hike again at their September meetings. US inflation has moderated faster than its peers, but economic growth expectations have been relatively resilient.
US Dollar Index (DXY) Weekly Chart
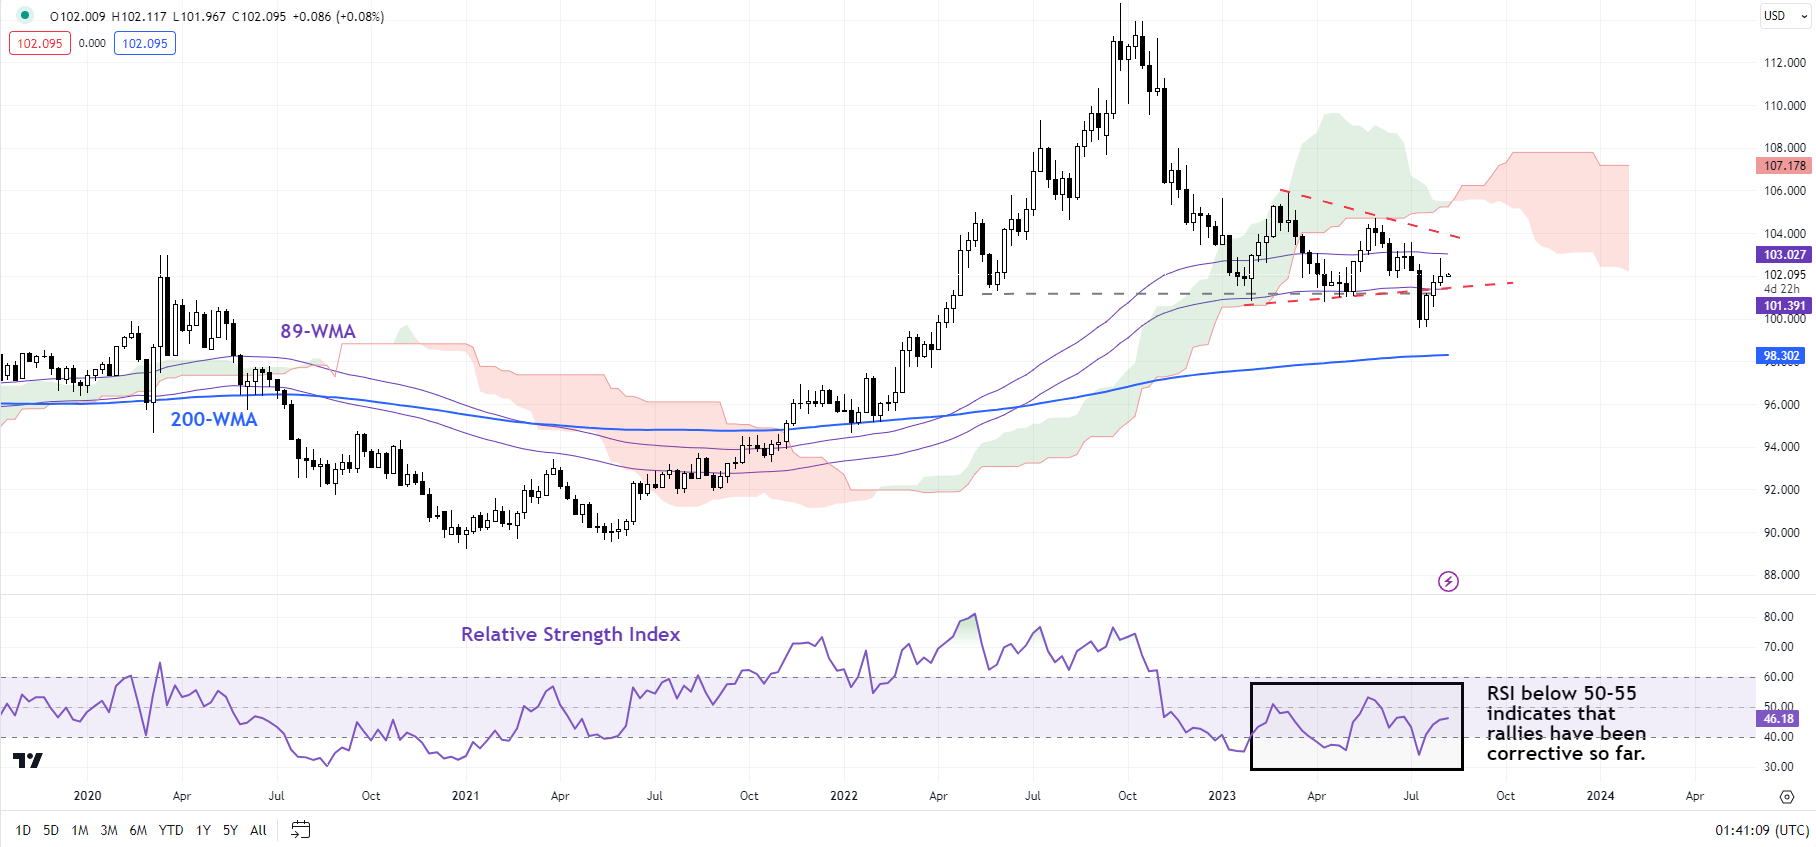
Chart Created by Manish Jaradi Using TradingView
DXY Index: Roadblock ahead
On technical charts, the US dollar index (DXY Index) posted a bearish evening star pattern on the daily candlestick charts toward the end of last week. The retreat came about from tough resistance on the 89-day moving average, slightly below the 200-day moving average.
DXY Index Daily Chart
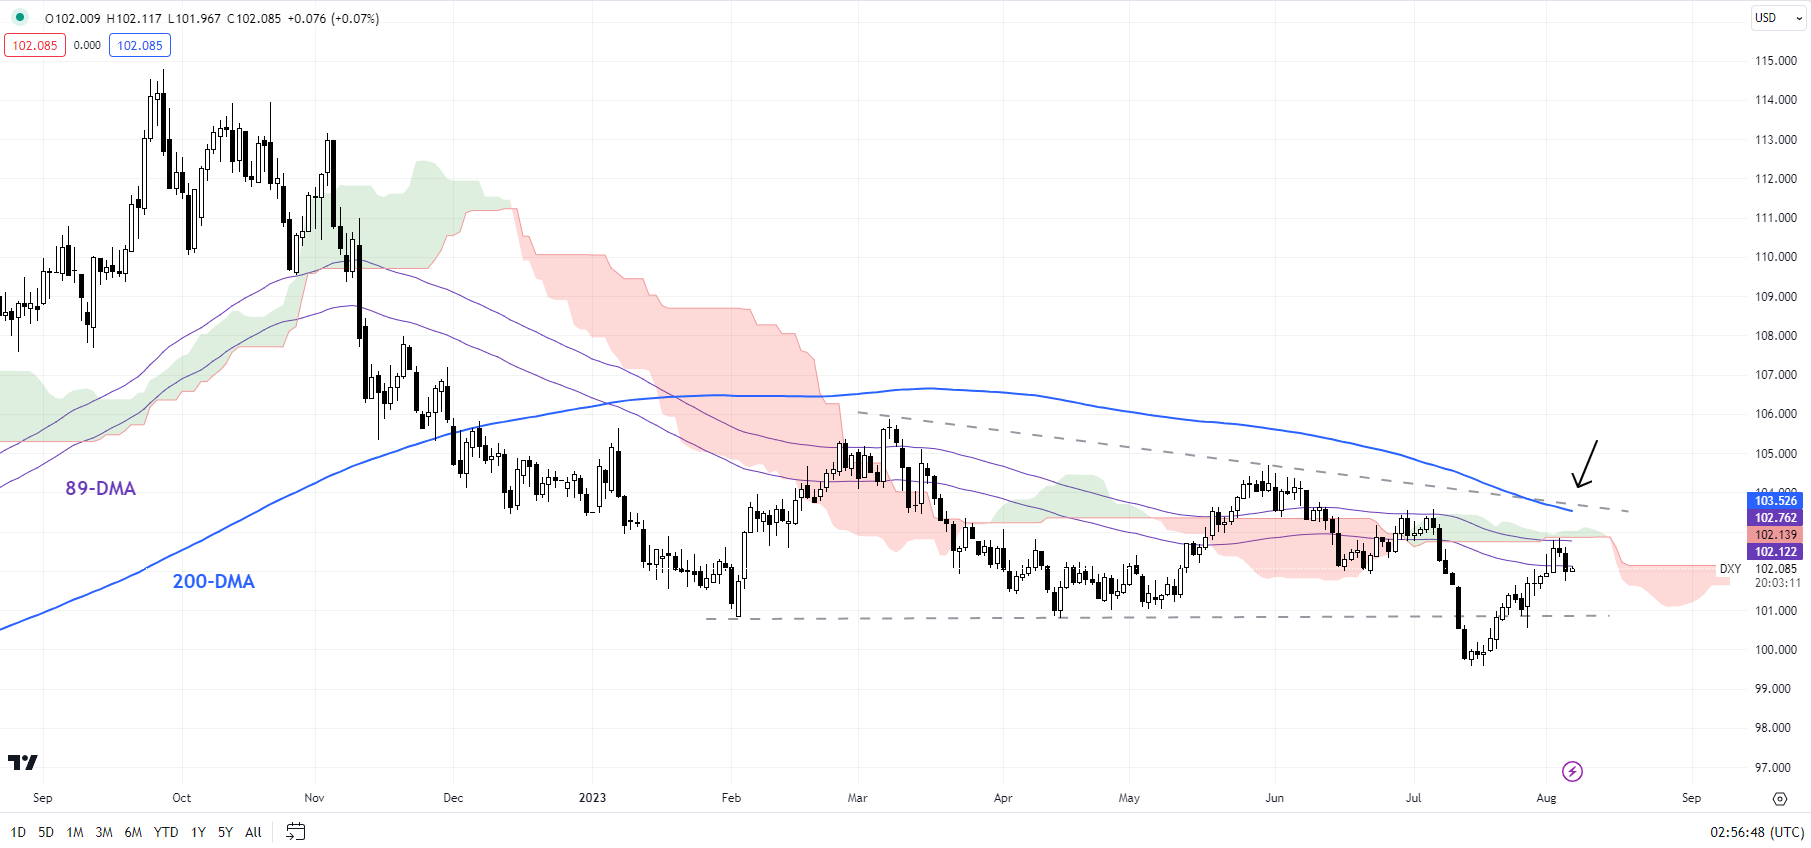
Chart Created by Manish Jaradi Using TradingView
On the weekly charts, despite the rallies in recent months, the 14-week Relative Strength Index (RSI) has failed to rise above 50-55 – the threshold that typically differentiates between a corrective rally and the start of a new trend. Granted, the price action is still unfolding – and the index could extend its rise. In this regard, the March high of 106 is key – any break above would raise the odds of meaningful gains.
EUR/USD Daily Chart
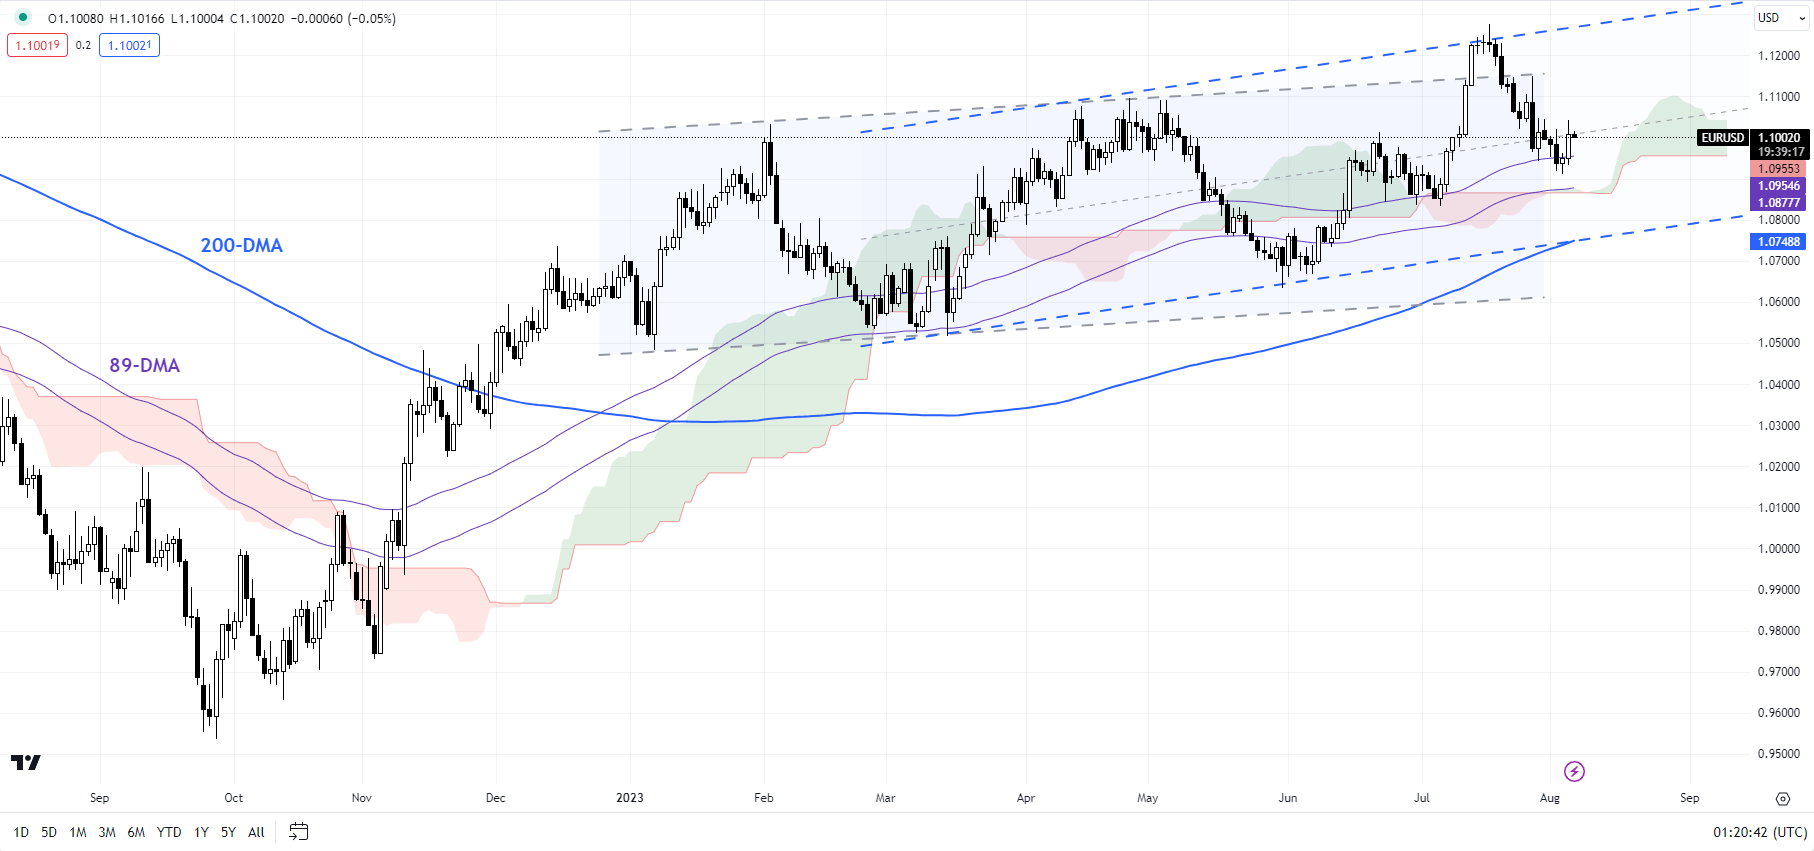
Chart Created by Manish Jaradi Using TradingView
EUR/USD: Still within the uptrend channel
The broader bias forEUR/USD remains up given the higher-highs-higher-lows pattern since late 2022. Most recently, the pair has been hovering in an upward-sloping channel since March. However, the consolidation could extend a bit further in the near term. For more discussion, see “Euro Lifted Slightly by US Downgrade, but Will it Last? EUR/USD, EUR/AUD, EUR/NZD Price Action,” published August 2.
GBP/USD Daily Chart
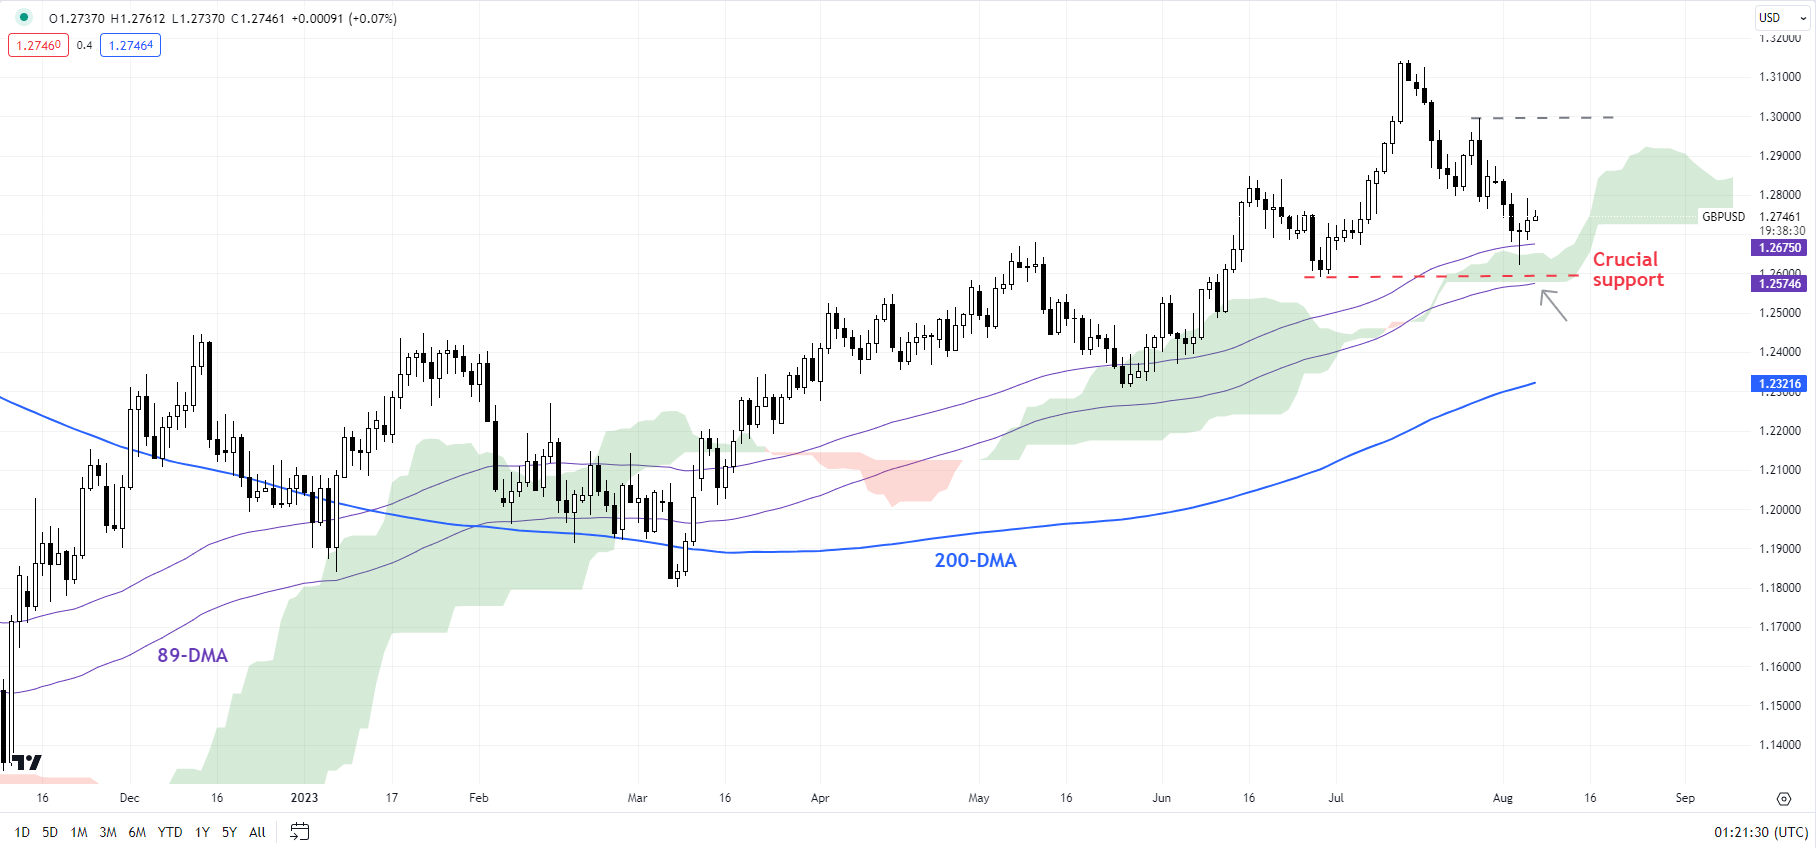
Chart Created by Manish Jaradi Using TradingView
GBP/USD: Attempts to rebound from strong support
GBP/USDis holding above fairly strong support at the end-June low of 1.2600, around the 89-day moving average and the lower edge of the Ichimoku cloud on the daily charts – a possibility pointed out in the previous update. See “British Pound Could Stage a Rebound: GBP/USD, EUR/GBP, GBP/JPY Price Setups After BOE,” published August 4. Generally, oversold conditions point to a minor rebound, potentially toward a stiff resistance area around 1.2800-1.2900.
USD/JPY Daily Chart
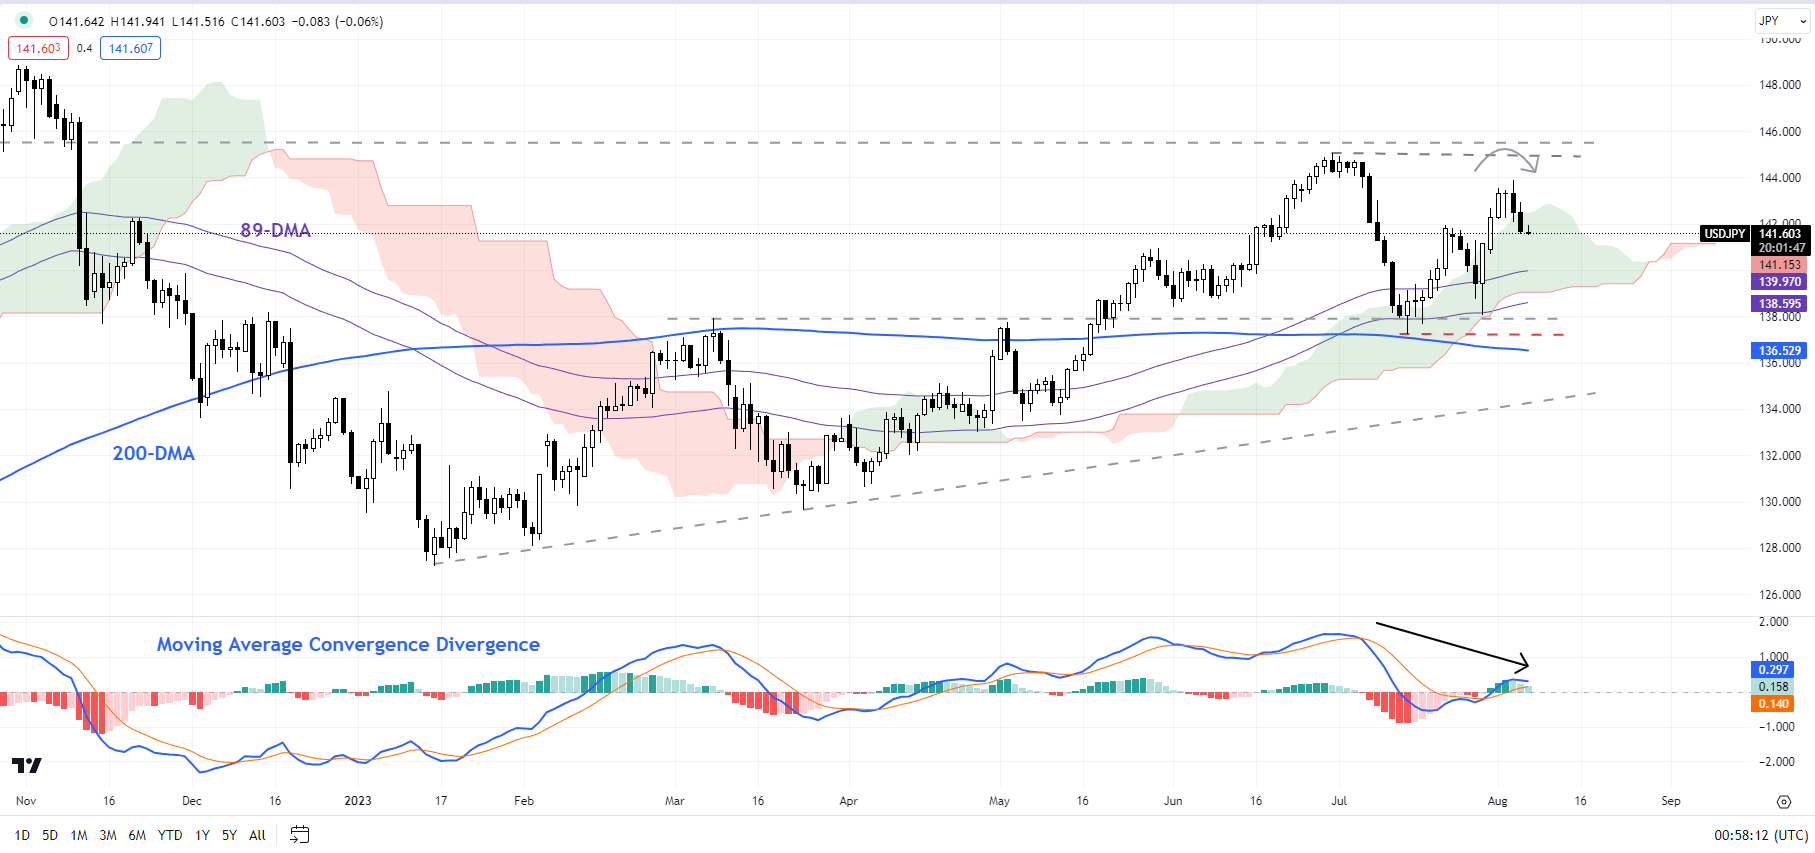
Chart Created by Manish Jaradi Using TradingView
USD/JPY: Rally fatigue setting in?
USD/JPY’s failure to decisively sustain gains above the crucial barrier at 141.50-142.00, including the 200-period moving average and the July 21 high of 142.00, is a sign that the post-BOJ meeting rebound is running out of steam. Still, the pair needs to break below key support at 140.25-141.25 to confirm that the immediate upward pressure has faded.